What the same house sold for 3 years later!
Price Appreciation Case Studies in South Snohomish & North King Counties
Since 2014, home values have grown by over 10% each year, resulting in a resounding 35% or more return in pricing. Below are some examples of actual homes sold in late 2017 to early 2018 that also sold in 2014, and that were not remodeled or significantly improved in between sales. These examples show the growth in home values that we have experienced over the last three years due to our thriving local economy. I pulled these examples to show you actual pound-for-pound market data versus the statistical percentages I often quote in these market updates. I thought these examples were pretty telling and quite exciting.
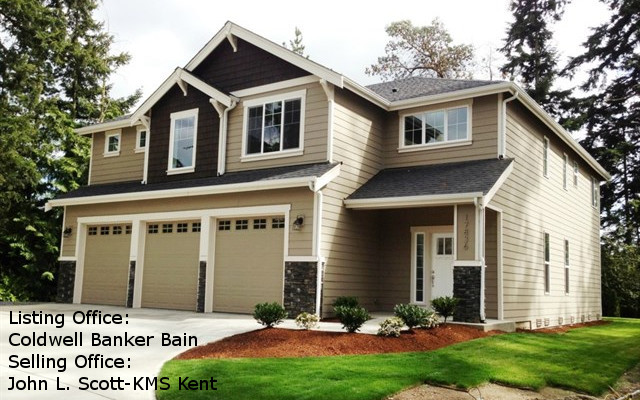
4 bedroom, 2,917 sq.ft. Shoreline Home:
Sold in November 2014: $560,000


Sold in January 2018: $800,000
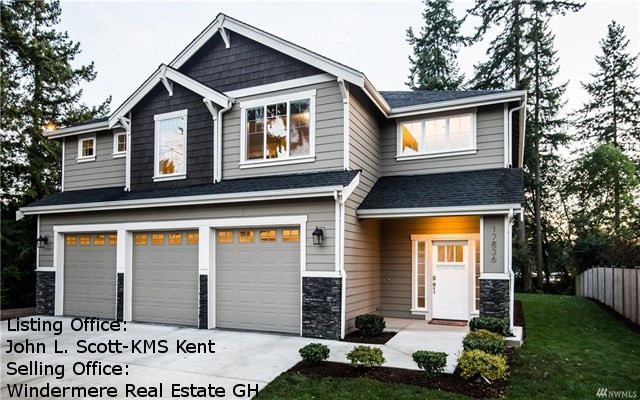
$240,000 INCREASE IN HOME VALUE: 42.85%
This phenomenon has been driven by a lack of available housing inventory and super high demand due to the robust job market in our area influenced by companies like Amazon. In 2017, there were 1,000 people moving into our area each week! According to census data, that trend is supposed to continue.
The large price gains might seem familiar to the gains of the previous up market of 2004-2007 that resulted in a bubble, but this environment is much different, which is why we are not headed toward a housing collapse. Previous lending practices allowed people to get into homes with risky debt-to-income ratios, low credit scores, and undocumented incomes. A large part of why the housing bubble burst 10 years ago was due to people getting into mortgages they were not equipped to handle, which lend to the eventual fall of sub-prime lending and the bubble bursting. Matthew Gardner, Windermere’s Chief Economist speaks to this topic in this video.
It is supply and demand that is creating these huge gains in prices. An increase in inventory would be healthy and would temper price growth. Many folks who have been waiting for their current home values to return in order to make big moves involving their retirement, upgrading homes, investing, or even buying a second home are well poised to enter the market. If you are one of those people, I hope these examples provide insight on the increase in home values and how they might pertain to your goals.
Potential buyers might shy away from the market due to affordability. While it is expensive to buy a home in the Greater Seattle area, the people that have become homeowners over the last three years have built some amazing wealth. Interest rates remain low, helping to absorb the cost of a home in our area. Last month, I wrote a Love Letter to Buyers which helped layout the advantages of participating in today’s market and how to be successful. If you or any one you know is considering making a purchase, it is worth the read.
As we head into the active spring and summer months, if you’d like a complimentary Comparable Market Analysis (CMA) on your home, so you have a better understanding of your home’s value, any of our agents would be happy to do that. This would be an important component in charting your 2018 financial goals, and what a great time of year to gather that information! It is our goal to help keep our clients informed and empower strong decisions.
3 bedroom, 1,305 sq.ft. Lynnwood Home:
Sold in September 2014: $315,000
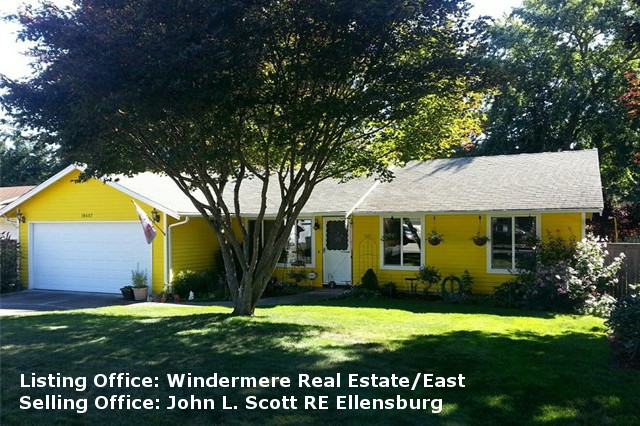

Sold in July 2017: $540,000
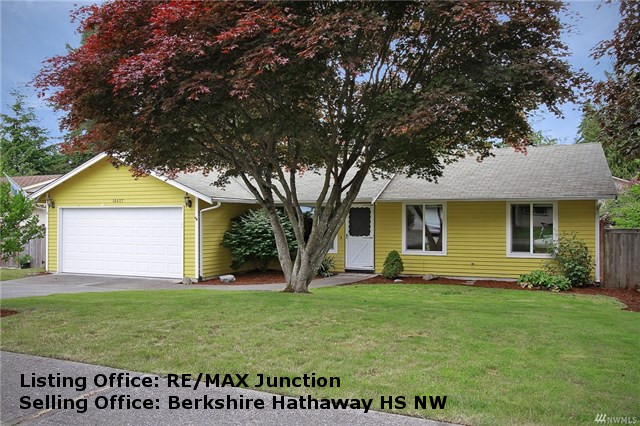
$135,000 INCREASE IN HOME VALUE: 42.85%
Cost vs Value for Home Improvements


I am commonly asked which improvements sellers should make to get the greatest return on their home sale. Every year The Remodeling 2018 Cost vs. Value Report (www.costvsvalue.com) compiles all the information and analyzes the estimated percentage return on home improvements in each region. Getting a home prepared for market requires a keen eye and great resources. To access the entire Cost vs. Value report please visit www.costvsvalue.com and follow the steps to locate the Seattle area report.
Also, I have a great list of reputable contractors from HVAC to plumbing to roofing who are licensed and bonded in the State of Washington. Please call on me whenever you need a solid recommendation. I am happy to help whether you are getting your home ready for market or just want to find a good window washer now that the sun is starting to shine a little more.
Complete data from the Remodeling 2018 Cost vs. Value Report can be downloaded free at www.costvsvalue.com
© Hanley Wood Media Inc.
A Love Letter to Buyers

|
|
|
|
|
|
|
|
|
|
|
|
Kenmore

Essential Kenmore Commuting Tips: Seaplanes, Buses, Bikes, Cars, & More!
Nestled along the northern shores of Lake Washington and in between Bothell, Brier, and Lake Forest Park, the city of Kenmore is in a central location. Whether you need to head north to Everett or south toward Bellevue or Seattle, several commuting options await at your fingertips!
With the help of local Jen Richardson-Bowman, we’ve put together this handy guide to commuting from Kenmore. From the more unique options of seaplanes and biking to more traditional driving and transit options, Kenmore offers a little bit of everything to suit your style.

Commuting in Kenmore by Plane
Perhaps the most unique commuting option in Kenmore is to commute by seaplane via Lake Washington. “Kenmore Air is a great options for chartering or taking scheduled flights to the San Juans, Canada, and beyond!” shares Jen. Kenmore Air also provides private charters to other areas—need to hop over to Lake Union? It’s a possibility with Kenmore Air!

Commuting in Kenmore by Car
“522 is the main drag in Kenmore and it connects commuters to Eastside and Seattle,” says Jen, and Kenmore is located in between Highway 405 (to the east) and Interstate-5 (to the north). There’s also the Kenmore Park-and-Ride as well, a facility with 603 parking space, bicycle lockers, and several buses coming and going all day long.

Commuting in Kenmore by Bus
“Bus stops are plentiful here!” shares Jen. Served by both King County Metro and Sound Transit, you can hop on a bus heading almost anywhere from Kenmore. Whether you need to get to Shoreline or head into Downtown Seattle to work, the vast network of buses makes it all possible. Click here to find more information on specific routes!

Commuting in Kenmore by Bike
“The Burke-Gilman Trail runs between 522 and Lake Washington [and] makes a VERY scenic route to work for cyclists who have a final destination in Redmond or Seattle (and places in between),” shares Jen. With beautiful views of Lake Washington and a convenient route that begins in Kenmore, the Burke-Gilman Trail is the perfect way to squeeze your daily workout and commute into one and the same! Click here to see a map complete with road access points.

Commuting by Light Rail
With Light Rail expanding north from Seattle, Kenmore residents will be able to take advantage of commuting while being able to skip car traffic! The Light Rail has several new stops planned from University of Washington to Everett that you might be able to take advantage of if you live in Kenmore. Click here to check out the complete list of projects, light rail station locations, and timelines.
Windermere Real Estate North Posted in Kenmore
Coming Soon to Kenmore: What You Can Expect in Kenmore’s Near Future
While Kenmore already offers a long list of excellent city amenities and a variety of housing options, there is always something new happening in the neighborhood. We wanted to take a moment to highlight 3 things you might especially be interested if you’re thinking about moving to Kenmore, and we talked to a couple of locals who have the scoop!
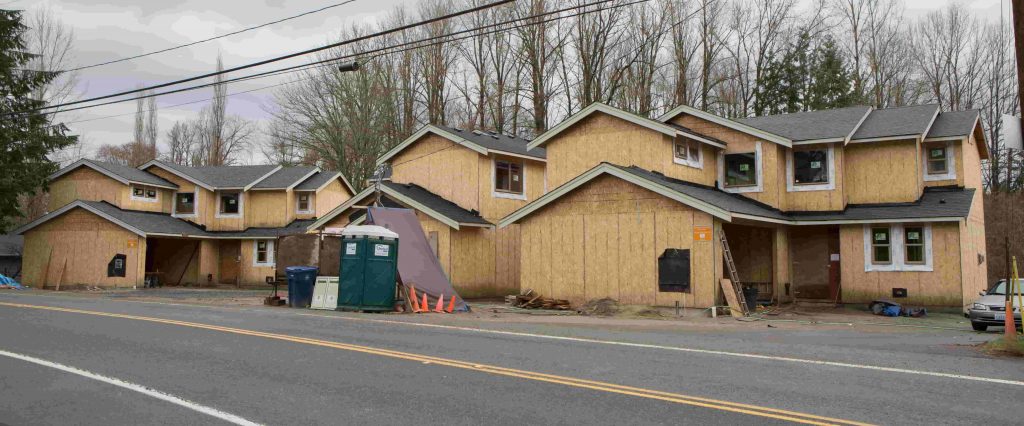
New Construction Homes
Curious about buying a home in Kenmore, WA? According to Jen Richardson-Bowman, “New construction abounds in Kenmore! It’s Northshore School District, so get ready for a little sticker shock!”
In Kenmore, you can expect to find some truly gorgeous homes. There are some incredible new construction homes, but there are older more established homes in the mix as well.
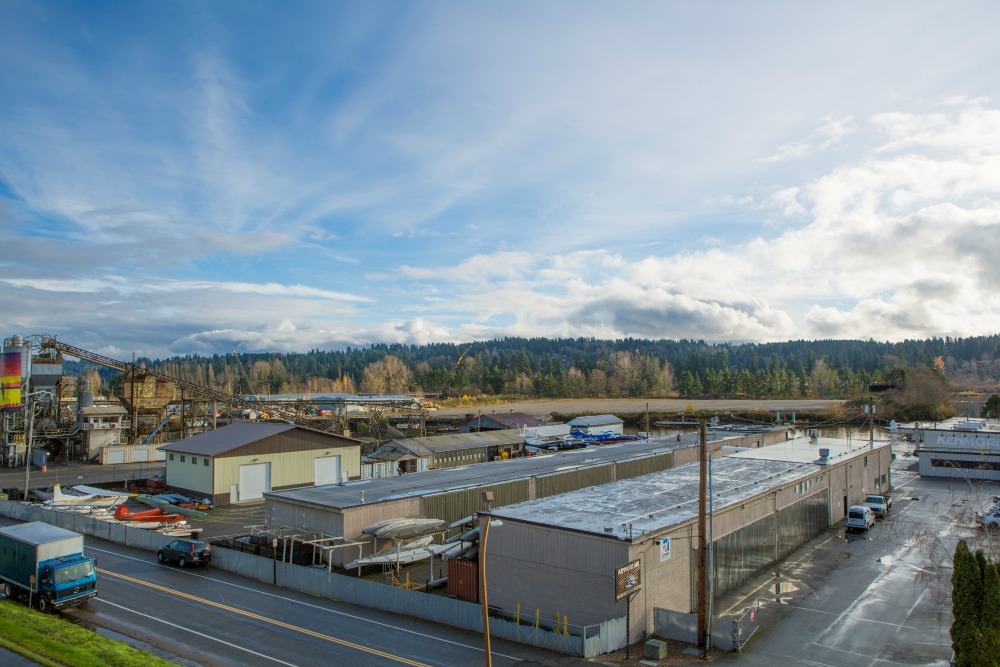
Lakepointe Waterfront Development
According to Michele Tenhulzen Kimes, “The waterfront development Lakepointe will transform the city by turning nearly 50 acres of industrial use space into shopping, dining and residential units.”
Located right on the shores of Lake Washington the Lakepointe development is a mixed-use development that will include a variety of land uses, and has been designed to “integrate the usage among residents, shoppers, vehicles, pedestrians and cyclists.” The plan was actually started back in 1989, and the proposed development has gone through several years of a citizen task force working with the developer to create a successful space. Weidner and Associates plans to invest $1 billion in the project.
Downtown Kenmore
Downtown Kenmore has been undergoing some serious changes, and there are even more redevelopment projects underway in the near future! While the Kenmore Town Square is complete, a new Hangar community building is in the works, and upcoming developments also include a large restaurant, commercial space, healthcare facilities, and more. Click here for the full overview of what you can expect in this Kenmore destination!
Your Guide to Enjoying the Lake Washington Waterfront in Kenmore
Though the warm weather has passed, that doesn’t mean you can’t start thinking about next summer’s adventures. We asked our locals for some tips on enjoying the Lake Washington waterfront and they gave us their top insights.

Here is your guide to enjoying the Lake Washington waterfront in Kenmore (as recommended by our locals):

Saint Edward State Park
- Located at 14445 Juanita Dr. N.E. Kenmore, WA 98028
When it comes to enjoying the waterfront in Kenmore, Saint Edward State Park (“set on the eastern shore of Lake Washington,” according to Claudette Meyer) cannot be beat. “This is the highlight of Kenmore in terms of getting out into the woods and feeling like you’re miles from home, but you’re not,” shares Jen Bowman. “Miles of hiking and wooded biking trails are found at this stunning state park. There’s a pretty hike from the top of the hill all the way down to Lake Washington (don’t forget good shoes since it’s a little steep). A huge playground next to the old seminary is a highlight for families.” Claudette seconds Jen’s recommendation, adding that “although we don’t get there often enough, my family and I love to explore the low forest hiking trails in Saint Edward State Park…Our more adventurous friends regularly go mountain biking on the many miles of trails in the park, with their 5 and 3-year-old in tow—there’s terrain for every skill level.” For a breath of fresh air the whole family will love, check out Saint Edward State Park today.

Log Boom Park
- Located at 17415 61st Ave. N.E. Kenmore, WA 98028
Whether you’re looking to cool off or explore the local waters, you can do that and so much more at Log Boom Park. “Log Boom Park, just off the north end of the Lake and right next to Burke Gilman Trail is an awesome place to take a dip in the lake off of a huge elevated dock,” says Jen. “Lots of places to launch kayaks or stand up paddleboards. Great views of Mount Rainier can be found here and fireworks on the Fourth of July. Also, it’s a great spot to watch Kenmore Air departures and arrivals.” For a day filled with fun and relaxation, Log Boom Park has you covered.

Kenmore Boat Launch
- Located at 17150 68th Ave. N.E. Kenmore, WA 98028
For those looking to get out on the water, the Kenmore Boat Launch is a secret gem. “The Kenmore boat launch is a hidden access point to Lake Washington,” says Casey Bui. “While it lacks a dock, it’s one of the few public boat launches in the northern half of Lake Washington. Its 2 boat launches and about 30 parking spaces are popular in the summer.”
“Launch the boat in Lake Washington,” says Jen. “[This] is the only public boat launch at the north end of Lake Washington. Parking can be very tight, so best to get there early on sunny summer days. Also a good spot to launch the paddle board or kayak and head east towards downtown Bothell on the slough. Lots of bird watching and very calm waters along the slough.” So, if you’re quick enough when those sunny summer days roll around, you can take advantage of all that Lake Washington has to offer at the Kenmore Boat Launch.

Sammamish River
Finally, if you’re still looking for ways to enjoy Lake Washington’s waterfront, rent a kayak and take it along the slow-moving Sammamish River. “Sammamish River [offers] kayaking rentals, located at the mouth leading to the north end of Lake Washington,” says Michele Kimes. Perfect for both beginners and more experienced kayakers, this river is one of the best ways to take in all of the beauty that makes the Lake Washington area such a popular warm-weather destination.
2018 Housing Market & Economy Predictions

6 Predictions for the 2018 Housing Market & Economy Header

At Windermere, we have the privilege of working with esteemed economist, Matthew Gardner. Throughout the year, I have shared his quarterly Gardner Reports which delineate out all the different housing markets in Western Washington and reports on price appreciation and sales data. Below is a recent article he wrote about predictions for the 2018 real estate market; which was picked up by several news sources, including Inman News.
As a bonus, I recently had the opportunity to chat with him and get some specific insights on the Greater Seattle real estate market for 2018 and have included those at the end of this article. 2018 looks to be another strong year in real estate. If you are curious about how the market might affect your bottom line, please contact me. It is my goal to help keep my clients informed, empower strong decisions and create exceptional results. Here’s to a very happy New Year!
What Can We Expect From the 2018 Housing Market?
by Matthew Gardner, Chief Economist, Windermere Real EstateMillennial Home Buyers
Last year, I predicted that the big story for 2017 would be millennial home buyers and it appears I was a little too bullish. To date, first-time buyers have made up 34% of all home purchases this year – still below the 40% that is expected in a normalized market. Although they are buying, it is not across all regions of the country, but rather in less expensive markets such as North Dakota, Ohio, and Maryland.For the coming year, I believe the number of millennial buyers will expand further and be one of the biggest influencers in the U.S. housing market. I also believe that they will begin buying in more expensive markets. That’s because millennials are getting older and further into their careers, enabling them to save more money and raise their credit profiles.
Existing Home Sales
As far as existing home sales are concerned, in 2018 we should expect a reasonable increase of 3.7% – or 5.62 million housing units. In many areas, demand will continue to exceed supply, but a slight increase in inventory will help take some heat off the market. Because of this, home prices are likely to rise but by a more modest 4.4%.New Home Sales
New home sales in 2018 should rise by around 8% to 655,000 units, with prices increasing by 4.1%. While housing starts – and therefore sales – will rise next year, they will still remain well below the long-term average due to escalating land, labor, materials, and regulatory costs. I do hold out hope that home builders will be able to help meet the high demand we’re expecting from first-time buyers, but in many markets it’s very difficult for them to do so due to rising construction costs.Interest Rates
Interest rates continue to baffle forecasters. The anticipated rise that many of us have been predicting for several years has yet to materialize. As it stands right now, my forecast for 2018 is for interest rates to rise modestly to an average of 4.4% for a conventional 30-year fixed-rate mortgage – still remarkably low when compared to historic averages.Tax Reform
There are changes to the income tax structure that could potentially have a significant impact on homeowners and the housing market. The first is the mortgage interest rate deduction which will be capped at $750,000 – down from $1,000,000. In theory this can be considered a tax on wealthy households, but there have been nearly 100,000 home sales this year where the mortgage loan was over $750,000 (almost 4% of total sales), so the effect will be felt more broadly.That said, this change will disproportionately affect high-cost markets in California, New York, and Hawaii, and to a somewhat lesser degree, it will also be felt in Seattle, and parts of Colorado and Arizona. The capping of the deduction for state and local property taxes (SALT) at $10,000 will also negatively impact states with high property taxes, such as California, New York, and New Hampshire.
The final tax bill also eliminates the deduction for interest on home equity loans which is currently allowed on loans up to $100,000. This is significant because it will largely affect the growing number of homeowners who are choosing to remodel their home rather than try to find a new home in supply-starved markets like Seattle.
While these measures will likely have a dampening effect on housing, I do not believe they will lead to a substantial drop in home values. However, there is a concern that it will lead to fewer home sales, as households choose to stay put so they can continue to take advantage of the current mortgage interest deduction. The result could be fewer listings, which could actually cause home prices to rise at above-average rates for a longer period of time.
Housing Bubble
I continue to be concerned about housing affordability. Home prices have been rising across much of the country at unsustainable rates, and although I still contend that we are not in “bubble” territory, it does represent a substantial impediment to the long-term health of the housing market. But if home price growth begins to taper, as I predict it will in 2018, that should provide some relief in many markets where there are concerns about a housing bubble.In summary, along with slowing home price growth, there should be a modest improvement in the number of homes for sale in 2018, and the total home sales will be higher than 2017. First-time buyers will continue to play a substantial role in the nation’s housing market, but their influence may be limited depending on where the government lands on tax reform.
https://www.windermere.com/blogs/windermere/posts/1701
Gardner, Matthew. “What Can We Expect From The 2018 Housing Market?” Windermere Real Estate. Windermere.com, 8 December 2017. Web. 27 December 2017.
A Conversation with Matthew
It is always a pleasure to talk with Matthew. We recently discussed his thoughts on the Greater Seattle real estate market and what he sees shaping up for 2018.
Millennial homebuyers were more of an influence in the Greater Seattle market in 2017 because of the robust hiring that corporations such as Amazon have made. He thinks that this will continue to grow in 2018, because the cost of rent continues to rise at a rapid pace and in many cases owning makes superior financial sense. For example, it is not unheard of to pay $3,000 a month in rent for a unit in South Lake Union. While this eliminates a commute, it is an incredibly costly payment that goes entirely towards the landlord’s investment. If one is willing and able to pay that much in rent, it is important to look at the fact that that number is equivalent to a mortgage payment on a $550,000 home! He predicts that we will see more millennial homebuyers move out to the more traditional suburbs to start building their wealth in real estate. Ideally, Millennials would love to live in “ex-urban” areas that are still close to their places of work; however, listings are slim and prices very high for this type of product.Therefore, he expects to see Millennials having to look at the suburbs when deciding where to buy.
In 2017, net in-migration totaled 50,000 in the Greater Seattle area. Matthew predicts that we will see the same in 2018 due to our robust job market and Californians continuing to move to the area. Employment in the region will continue to expand, but at lower rates than seen in 2017. That said, he sees more wage growth than job growth in 2018 as companies have done so much hiring over the last 3 years, and now they are focused on maintaining their employee base. Amazon has signed on to occupy 5 million additional square feet of space over and above the 8+ million square feet that they currently occupy, so we will continue to see job growth there. The unemployment rate will stay below 4% in 2018.
Matthew believes we will see a slight increase in inventory taking our market to hot from boiling. Some new construction will help this increase and he does expect to see some Baby Boomers deciding to either cash-out and leave the area, or downsize. This inventory growth should temper price growth and increase sales by 6%. In 2017, we saw a year-over-year price appreciation rate of 13% in the Greater Seattle area, and he predicts 8-8.5% for 2018. This is still well above the normal rate of 5.5%, but certainly much more sustainable than 13%!
Lastly, Matthew is adamant that we are not headed toward another bubble. The average down payment in the Greater Seattle area is now over $100,000 and home owners have great equity positions, which is a critical ingredient to a non-bubble market. Additionally, credit is still very tight and buyers are very highly qualified, and the rampant speculation that is the key sign of a bubble is not being seen locally. His biggest concern is affordability, and that we need to continue to find ways to create more housing through zoning changes and decreasing the cost of regulation for builders. This density would create more affordable housing.
Windermere Real Estate North Posted in Local Market Analysis Tagged Affordability, Buyer Demand, Economics, Equity, First Time Home Buyers, Home Values, Housing Bubble, Interest Rates, Millennials, New Listings, Real Estate, Real Estate Bubble
North Snohomish County
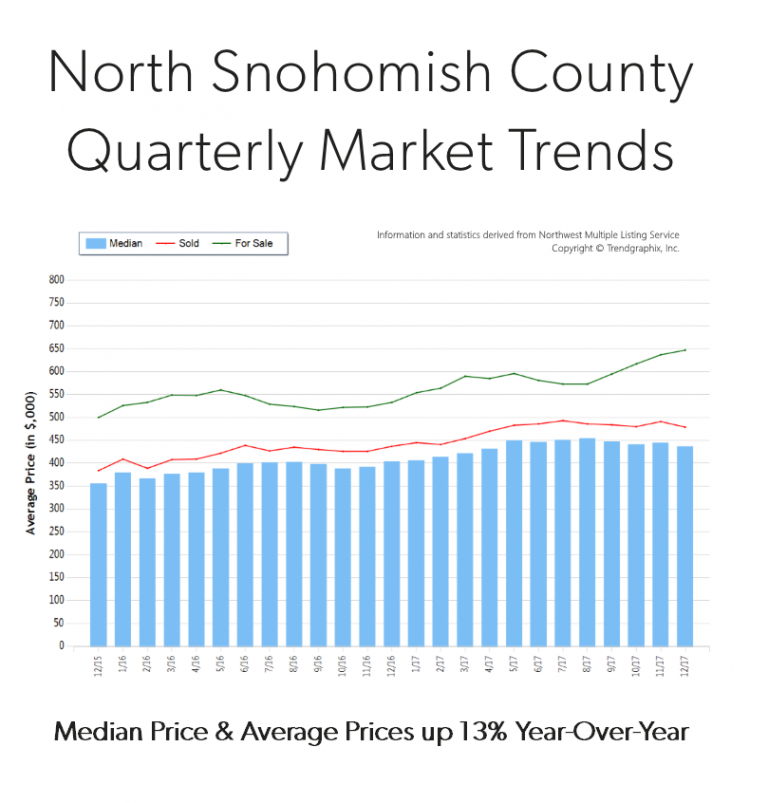
Quarterly Market Trends: North Snohomish County
Q4 2017
 Price growth was particularly strong in 2017! Median and average prices were up 13% over 2016. Median price in 2017 landed at $371,000 and the average at $400,000. The average amount of days it took to sell a house in 2017 was 35 days, which is 10% faster than 2016. The average list-to-sale price ratio over the last year was 99%, with the spring months as high as 101%! In 2017, inventory growth continued to be a challenge, with an 8% decrease in new listings compared to 2016. Even with inventory limitations there were 3% more sales! This phenomenon illustrates strong buyer demand and a need for more listings.
North Snohomish County real estate has seen a steady stream of buyers come our way due to affordability and quality of life. In fact, the median price in 2017 was 37% higher in south Snohomish County. Historically low interest rates continue to drive the market as well, they have helped offset the increase in prices. Sellers are enjoying great returns due to this phenomenon and buyers are securing mortgages with minor debt service.
This is only a snapshot of the trends in north Snohomish County; please contact us if you would like further explanation of how the latest trends relate to you.
Windermere Real Estate North Posted in Local Market Analysis, Quarterly Reports Tagged Affordability, Buyer Demand, Economics, Housing Inventory, Housing Market, Listing Inventory, Market Research, Millennials, Price Positioning, Prices, Quarterly Report, Snohomish County, Supply & Demand
Eastside
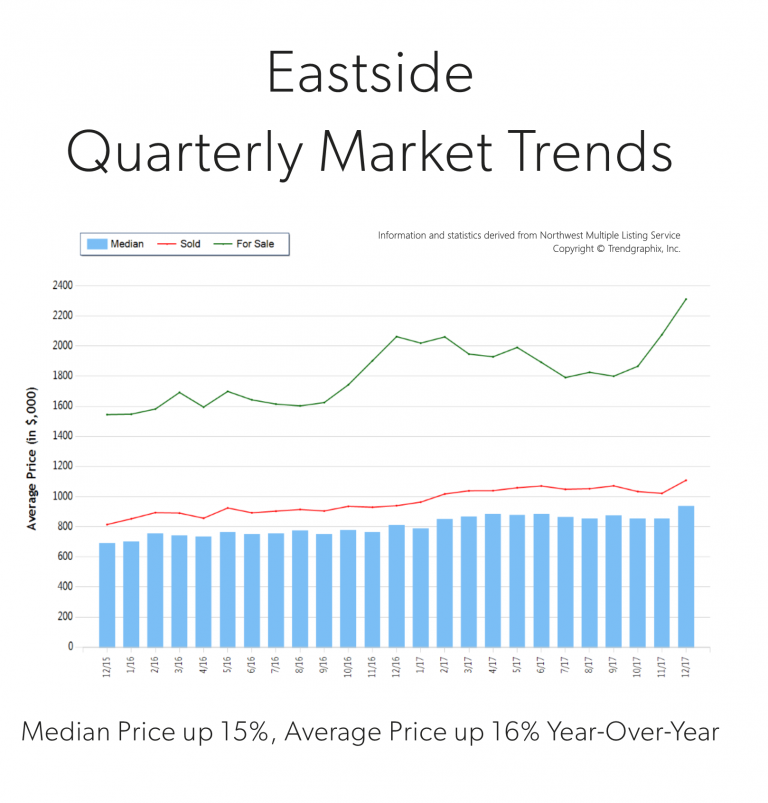
Quarterly Market Trends: Eastside
Q4 2017
 Price growth was particularly strong in 2017! Median was up 15% and average price up 16% over 2016. Median price in 2017 landed at $865,000 and the average at $1,049,000. The average amount of days it took to sell a house in 2017 was 24 days, which is 17% faster than 2016. The average list-to-sale price ratio over the last year was 101%, with the spring months as high as 103%! In 2017, inventory growth continued to be a challenge, with a 4% decrease in new listings compared to 2016. Even with inventory limitations there were a near equal amount of sales! This phenomenon illustrates strong buyer demand and a need for more listings.
Demand for Eastside real estate has grown due to close proximity to job centers, great schools and quality of life. Over the last year, the Eastside was 70% more expensive than south Snohomish County and 22% over Seattle Metro. Historically low interest rates continue to drive the market as well, they have helped offset the increase in prices. Sellers are enjoying great returns due to this phenomenon and buyers are securing mortgages with minor debt service.
This is only a snapshot of the trends on the Eastside area; please contact us if you would like further explanation of how the latest trends relate to you.
Windermere Real Estate North Posted in Local Market Analysis, Quarterly Reports Tagged Affordability, Appreciation, Buyer Demand, Eastside, First Time Home Buyers, Home Values, Housing Inventory, Housing Market, Interest Rates, King County, Market Research, Millennials, Mortgage, New Listings, Price Appreciation, Prices, Quarterly Report, Real Estate, Supply & Demand
Seattle Metro
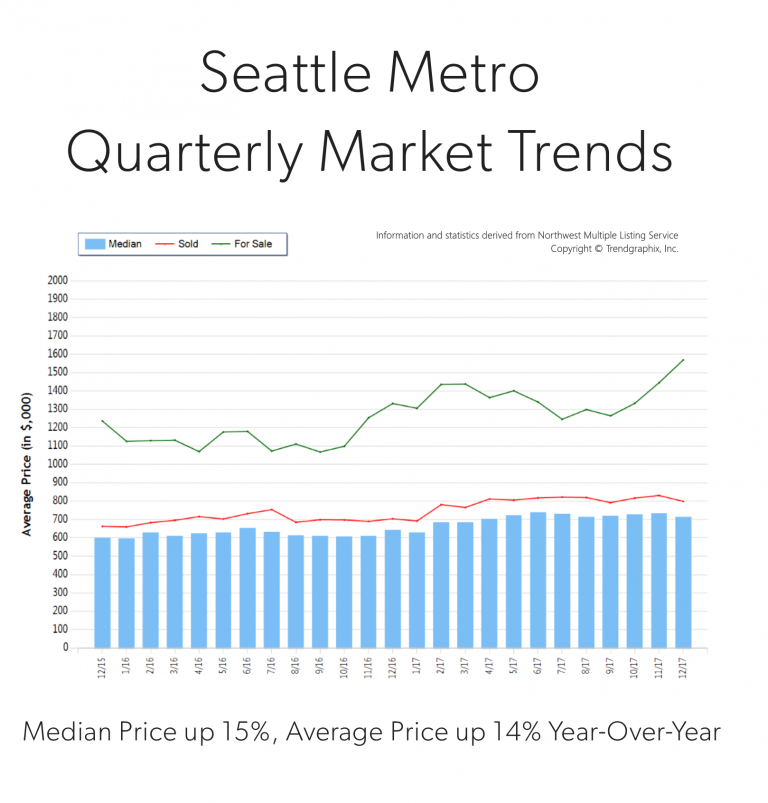
Quarterly Market Trends: Seattle Metro
Q4 2017
 Price growth was particularly strong in 2017! Median was up 15% and average price up 14% over 2016. Median price in 2017 landed at $710,000 and the average at $801,000. The average amount of days it took to sell a house in 2017 was 18 days, which is 10% faster than 2016. The average list-to-sale price ratio over the last year was 103%, with the spring months as high as 106%! In 2017, inventory growth continued to be a challenge, with a 3% decrease in new listings compared to 2016. Even with inventory limitations there were 4% more sales! This phenomenon illustrates strong buyer demand and a need for more listings.
Demand for Seattle Metro area real estate has grown due to close proximity to job centers. Over the last year, Seattle Metro was 40% more expensive than south Snohomish County and 75% over south King County. Historically low interest rates continue to drive the market as well, they have helped offset the increase in prices. Sellers are enjoying great returns due to this phenomenon and buyers are securing mortgages with minor debt service.
This is only a snapshot of the trends in the Seattle Metro area; please contact us if you would like further explanation of how the latest trends relate to you.
Windermere Real Estate North Posted in Local Market Analysis, Quarterly Reports Tagged Affordability, Appreciation, Buyer Demand, Commute Times, Economics, King County, Listing Inventory, Market Research, Millennials, Mortgage, New Listings, Price Appreciation, Prices, Quarterly Report, Real Estate, Seller’s Market
South Snohomish County
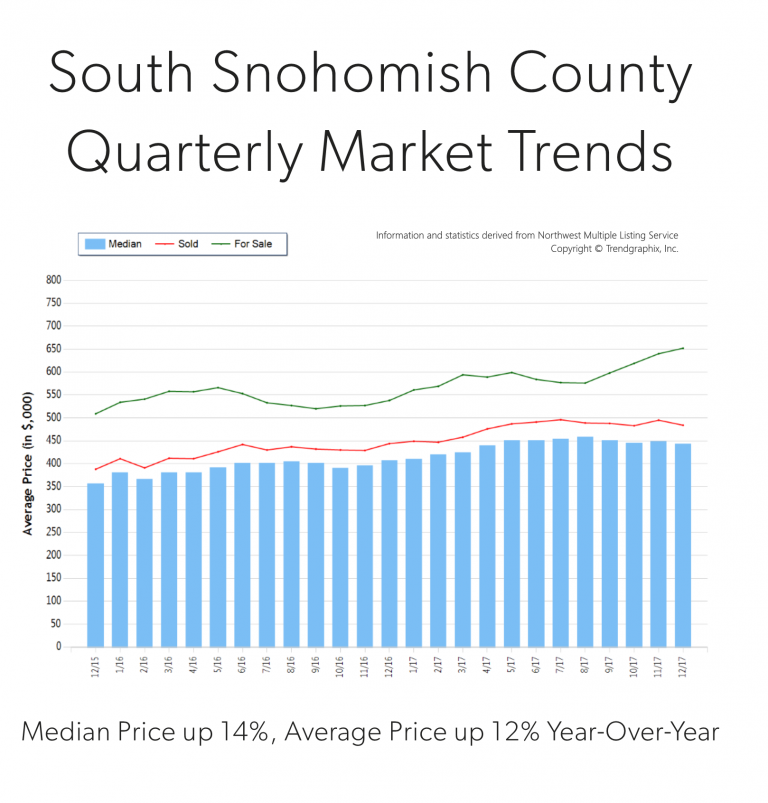
Quarterly Market Trends: South Snohomish County
Q4 2017
 Price growth was particularly strong in 2017! Median was up 14% and average price up 12% over 2016. Median price in 2017 landed at $508,000 and the average at $543,000. The average amount of days it took to sell a house in 2017 was 24 days, which is 17% faster than 2016. The average list-to-sale price ratio over the last year was 101%, with the spring months as high as 103%! In 2017, inventory growth continued to be a challenge, with a 1% decrease in new listings compared to 2016. Even with inventory limitations there were 4% more sales! This phenomenon illustrates strong buyer demand and a need for more listings.
South Snohomish County real estate has seen a steady stream of buyers come our way due to affordability, reasonable commute times to job centers and quality of life. In fact, the median price in 2017 was 41% higher in north King County. Historically low interest rates continue to drive the market as well, they have helped offset the increase in prices. Sellers are enjoying great returns due to this phenomenon and buyers are securing mortgages with minor debt service.
This is only a snapshot of the trends in south Snohomish County; please contact us if you would like further explanation of how the latest trends relate to you.
Windermere Real Estate North Posted in Local Market Analysis, Quarterly Reports Tagged Affordability, Appreciation, Buyer Demand, Commute Times, First Time Home Buyers, Home Values, Housing Inventory, Housing Market, Market Research, Millennials, Mortgage, Price Appreciation, Quarterly Report, Real Estate, Supply & Demand
North King County
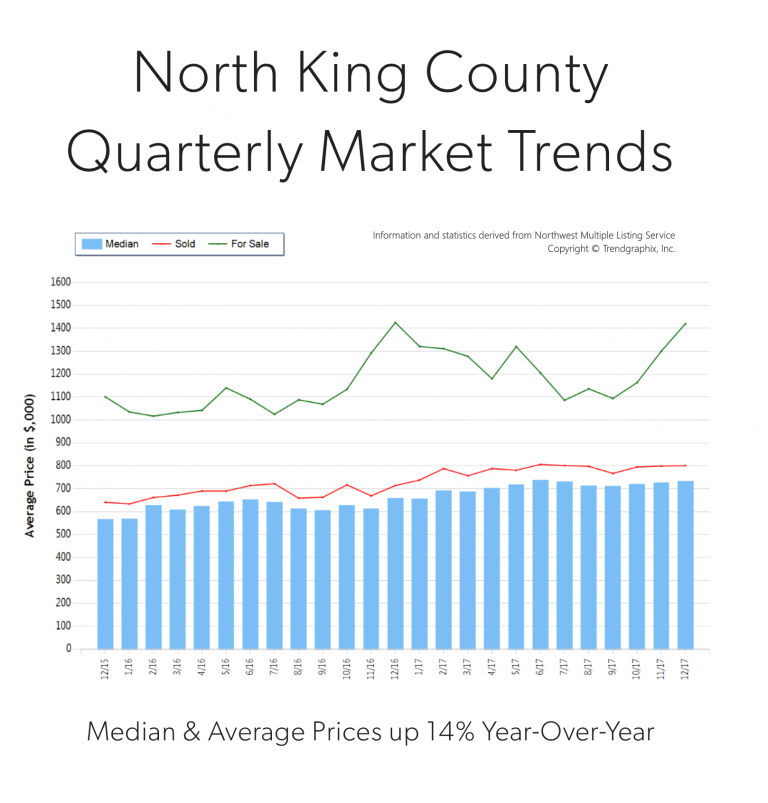
Quarterly Market Trends: North King County
Q4 2017
 Price growth was particularly strong in 2017! Median and average prices were up 14% over 2016. Median price in 2017 landed at $715,000 and the average at $787,000. The average amount of days it took to sell a house in 2017 was 17 days, which is 19% faster than 2016. The average list-to-sale price ratio over the last year was 104%, with the spring months as high as 107%! In 2017, inventory growth continued to be a challenge, with a 4% decrease in new listings compared to 2016. Even with inventory limitations there were a near equal amount sales! This phenomenon illustrates strong buyer demand and a need for more listings.
Demand for north King County real estate has grown due to close proximity to job centers while maintaining a neighborhood feel. Over the last year, north King County was 41% more expensive than south Snohomish County and 77% over south King County. Historically low interest rates continue to drive the market as well, they have helped offset the increase in prices. Sellers are enjoying great returns due to this phenomenon and buyers are securing mortgages with minor debt service.
This is only a snapshot of the trends in north King County; please contact us if you would like further explanation of how the latest trends relate to you.
Windermere Real Estate North Posted in Local Market Analysis, Quarterly Reports Tagged Affordability, Appreciation, Buyer Demand, Commute Times, Equity, First Time Home Buyers, Home Values, Housing Market, King County, Market Research, Millennials, Mortgage, Price Appreciation, Prices, Quarterly Report, Real Estate, Seller’s Market
 Facebook
 X
X
 Pinterest
 Copy Link


