Quarterly Market Trends: North Snohomish County
Q4 2017
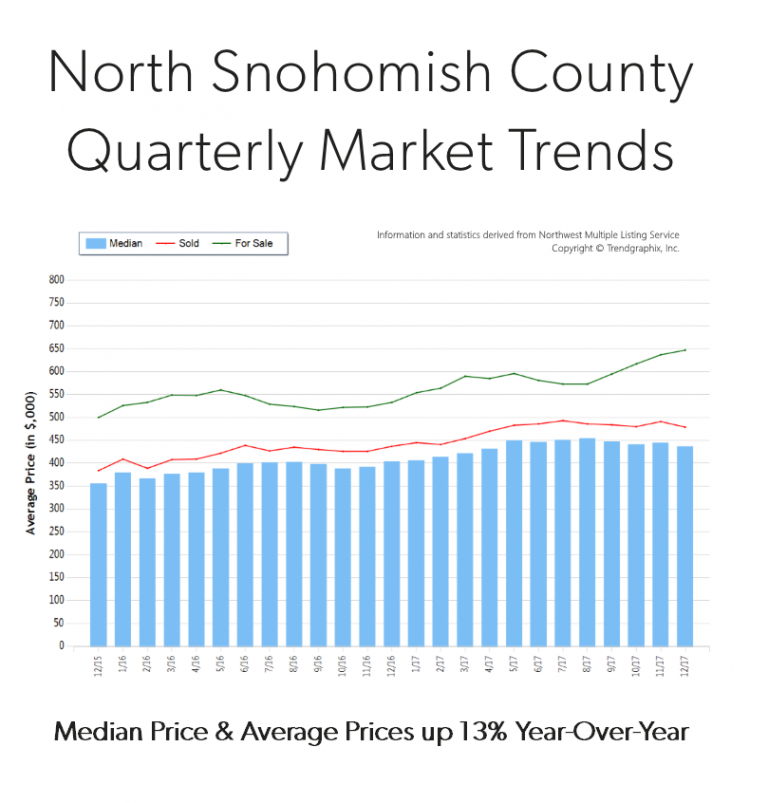
 Price growth was particularly strong in 2017! Median and average prices were up 13% over 2016. Median price in 2017 landed at $371,000 and the average at $400,000. The average amount of days it took to sell a house in 2017 was 35 days, which is 10% faster than 2016. The average list-to-sale price ratio over the last year was 99%, with the spring months as high as 101%! In 2017, inventory growth continued to be a challenge, with an 8% decrease in new listings compared to 2016. Even with inventory limitations there were 3% more sales! This phenomenon illustrates strong buyer demand and a need for more listings.
North Snohomish County real estate has seen a steady stream of buyers come our way due to affordability and quality of life. In fact, the median price in 2017 was 37% higher in south Snohomish County. Historically low interest rates continue to drive the market as well, they have helped offset the increase in prices. Sellers are enjoying great returns due to this phenomenon and buyers are securing mortgages with minor debt service.
This is only a snapshot of the trends in north Snohomish County; please contact us if you would like further explanation of how the latest trends relate to you.
Windermere Real Estate North Posted in Local Market Analysis, Quarterly Reports Tagged Affordability, Buyer Demand, Economics, Housing Inventory, Housing Market, Listing Inventory, Market Research, Millennials, Price Positioning, Prices, Quarterly Report, Snohomish County, Supply & Demand
 Facebook
 X
X
 Pinterest
 Copy Link
