The Zillow Algorithm vs The Human Algorithm: What is best for the consumer?

The recent news of Zillow’s plan to shut down their iBuyer program due to a $328 million loss in the third quarter has heads spinning in the real estate world and on Wall Street. Sadly, Zillow plans to eliminate 25% of its workforce because of its decision to move away from the practice of purchasing and re-selling homes due to their mismanagement of property price evaluations. “Fundamentally, we have been unable to predict the future pricing of homes to a level of accuracy that makes this a safe business to be in,” Zillow CEO Rich Barton.
This is a bold statement from a CEO who built their company on a computer algorithm that spits out a home value called, the Zestimate. A Zestimate is an AVM (Automated Valuation Model). The product of an automated valuation technology comes from analysis of public record data and computer decision logic combined to provide a calculated estimate of a probable selling price of a residential property. An AVM generally uses a combination of two types of evaluation, a hedonic model and a repeat sales index. The results of each are weighted, analyzed, and then reported as a final estimate of value based on a requested date.
Zillow’s iBuyer program sought to find eager home sellers who wanted a quick, no-nonsense sale. They would present a cash offer based on their algorithm and close on a mutually agreed-upon date. After closing, Zillow would turn these properties around with some improvements and bring them back to the market. This is often labeled a “flip”. The problem was Zillow overpaid for the majority of their purchases which proved that their computer-generated evaluation (AVM) lacks market accuracy.
On average, they re-sold these homes for $80,800 less than what they purchased them for. Thorough market research that includes touring the subject and neighboring properties, seeking info from other brokers about the terms of recent sales and overall experience helps to determine accurate market conditions in comparison to the swirl of data used to establish the Zestimate. Computers can’t do this type of in-depth research, nor do they have the instinct to predict shifts in the market, but humans (real estate brokers) can!
Often times when I am talking with potential sellers, their Zestimate (or other AVMs) come up in the overall conversation. I understand why, too. This is information that is relatively easy to access and gives the seller a starting point on the value of their home. Where an AVM can become dangerous is when a consumer thinks it’s the be-all, end-all. Even worse, when a consumer makes a major financial decision solely based on this information. According to Zillow, 39% of all Zestimates in the Seattle metro area are not within 5% of the actual value. In fact, they publish an accuracy report that you can access here.
In October, the median home price in the Seattle Metro area was $850,000. With 39% of all Zestimates not within 5% of the actual value, that is a beginning margin of error of $42,500! Further, they claim that 82% of their Zestimates are within 10% of the actual value, which is a marked difference – up to $85,000. Where AVMs are incomplete is that the basis of their formula is tax records, which in my experience are often inaccurate. Also, and most importantly, an AVM does not take into consideration the condition of the home, the neighborhood, and other environmental impacts such as school district, road noise, and unsightly neighboring homes, to name a few.
So why does the Zestimate exist? Zillow is a publicly-traded company (ZG) and their website is the vehicle to create profit. The Zestimate drives consumers to the website who are often dipping their toes in the pool to see what their home might be worth or searching available homes for sale. When a consumer is searching on Zillow’s website they are surrounded by real estate broker and mortgage broker ads on every page. These real estate brokers and mortgage brokers are paying for that advertising space, which is how Zillow makes its money and why there is a Zestimate. The Zestimate is not a public service, it is a widget to bring eyes to their advertising space which in turn, sells more ads to brokers looking for leads.
The moral of the story is this: use Zillow as one of the many tools in your real estate evaluation and search toolbox. Zillow provides a great starting point and contains a ton of information to whet your palate when embarking on a real estate endeavor. However, we live in a time of information overload and we are overstimulated at best. Nothing beats the evaluation and discernment of a knowledgeable and experienced real estate broker to help you determine accuracy, which will lead to the empowerment of clarity. At Windermere, we like to call this, The Human Algorithm.
If you are curious about the value of your home in today’s market, please contact me. I can provide an annual real estate review of all of your real estate holdings, and can even dive deep into a complete comparative market analysis if you would find that helpful. It is my goal to help keep my clients informed and empower strong decisions.
Zillow® and Zestimate® are trademarks of Zillow, Inc.
 Matthew Gardner is the Chief Economist at Windermere and a sought-after expert on real estate, both locally and across the country. Every quarter, Matthew breaks down the real estate market by region and provides the Gardner Report; you can read this quarter’s full report here.
If you have any questions or curiosity about the current real estate market that you would like to discuss, please reach out. Are you curious about the value of your home, are you contemplating a move, or considering a new purchase? I can help! It is always my goal to help empower my clients to make strong financial decisions and to help them understand how real estate can positively affect their lifestyle.
Finding Buyer Success in a Seller’s Market: The Triangle of Buyer Clarity

Embarking on a home purchase in a seller’s market can be intimidating, but it can be done. Long-term price growth confirms that owning a home is a key element to building household wealth. Home equity gained over time is typically the largest asset that contributes to a household’s net worth. Homeownership is not only an investment, but also provides shelter and fits the lifestyle needs of the owner. We have seen many lifestyle-driven moves during the pandemic highlighting the value of location and features for buyers. Also, with the advent of remote work, many buyers have been able to be more flexible in determining their top locations. This has contributed to stronger price growth in suburban and rural locations.
 Buyers having a well-thought-out plan is paramount to finding success in today’s market. Partnering with their broker to assess their budget and how it relates to the location(s) and features they desire is the strategic formula that helps a buyer gain clarity. Buyer clarity is what leads a buyer to be able to make a sound decision to offer on a home. If a buyer is not clear, they will not be empowered to make a decision; in turn elongating the process and costing them more money. We have seen intense price growth since the beginning of the year illustrating the cost of waiting. In King County median price is up 16% year-over-year and up 21% in Snohomish County.
The tool that we use to help a buyer determine a productive search for their new home is The Triangle of Buyer Clarity. It is an expert tool for a buyer to help determine the parameters of their home search in order to save them time and money. The relationship between Price, Location, and Features/Condition is paramount in helping a buyer gain clarity and efficiency in their search.
Helping buyers stay focused on the reality of what their budget can afford them by applying The Triangle is an effective tool. For instance, if a buyer is set on a turn-key home that requires minimal updates, they may have to go up in price or further out in location, or both. The sides of The Triangle are often adjusted to make an uneven triangle, resulting in an effective home search and a successful purchase. An equilateral triangle is like a unicorn; buyers often have to adjust at least one side of the triangle to match the market with their ability to perform. Now here’s the geometry lesson: a buyer will often start the process with an equilateral triangle in mind, but will find success with either an isosceles (two equal sides) or a scalene (no equal sides) triangle. The moral of the geometry lesson is we have to be willing to compromise.
Understanding that compromise is OK and that it is actually a tool is when a buyer gains the clarity they need to successfully move forward. This is even further nuanced when two people are buying a home together; the adjustments must be done as a team. A skilled broker is well-versed in helping guide this process and making sure each participant is being heard and hearing each other. At the end of the day, real estate is a relationship business, and effectively curating this process is dependent on trust and care.
Helping buyers find their next home is one of the most joy-filled activities I have the honor of being a part of. It may appear simple, but it is not. The crucial conversations, contemplation, and planning that happen in order to find success are intentional. Taking the time upfront to analyze my buyers’ goals instead of just jumping in the car and starting to look at homes is a responsible part of my process that builds trust and effectively leads to success. It is my goal to help keep my clients well informed in order to empower thoughtful decisions. If you have any questions about the market or you’re ready to dive in, please reach out.
On this episode of “Monday with Matthew,” Matthew analyzes the latest Home Purchase Sentiment Index survey by Fannie Mae which helps us understand how buyers and sellers are feeling about the housing market.
QUARTERLY REPORTS Q3 2021
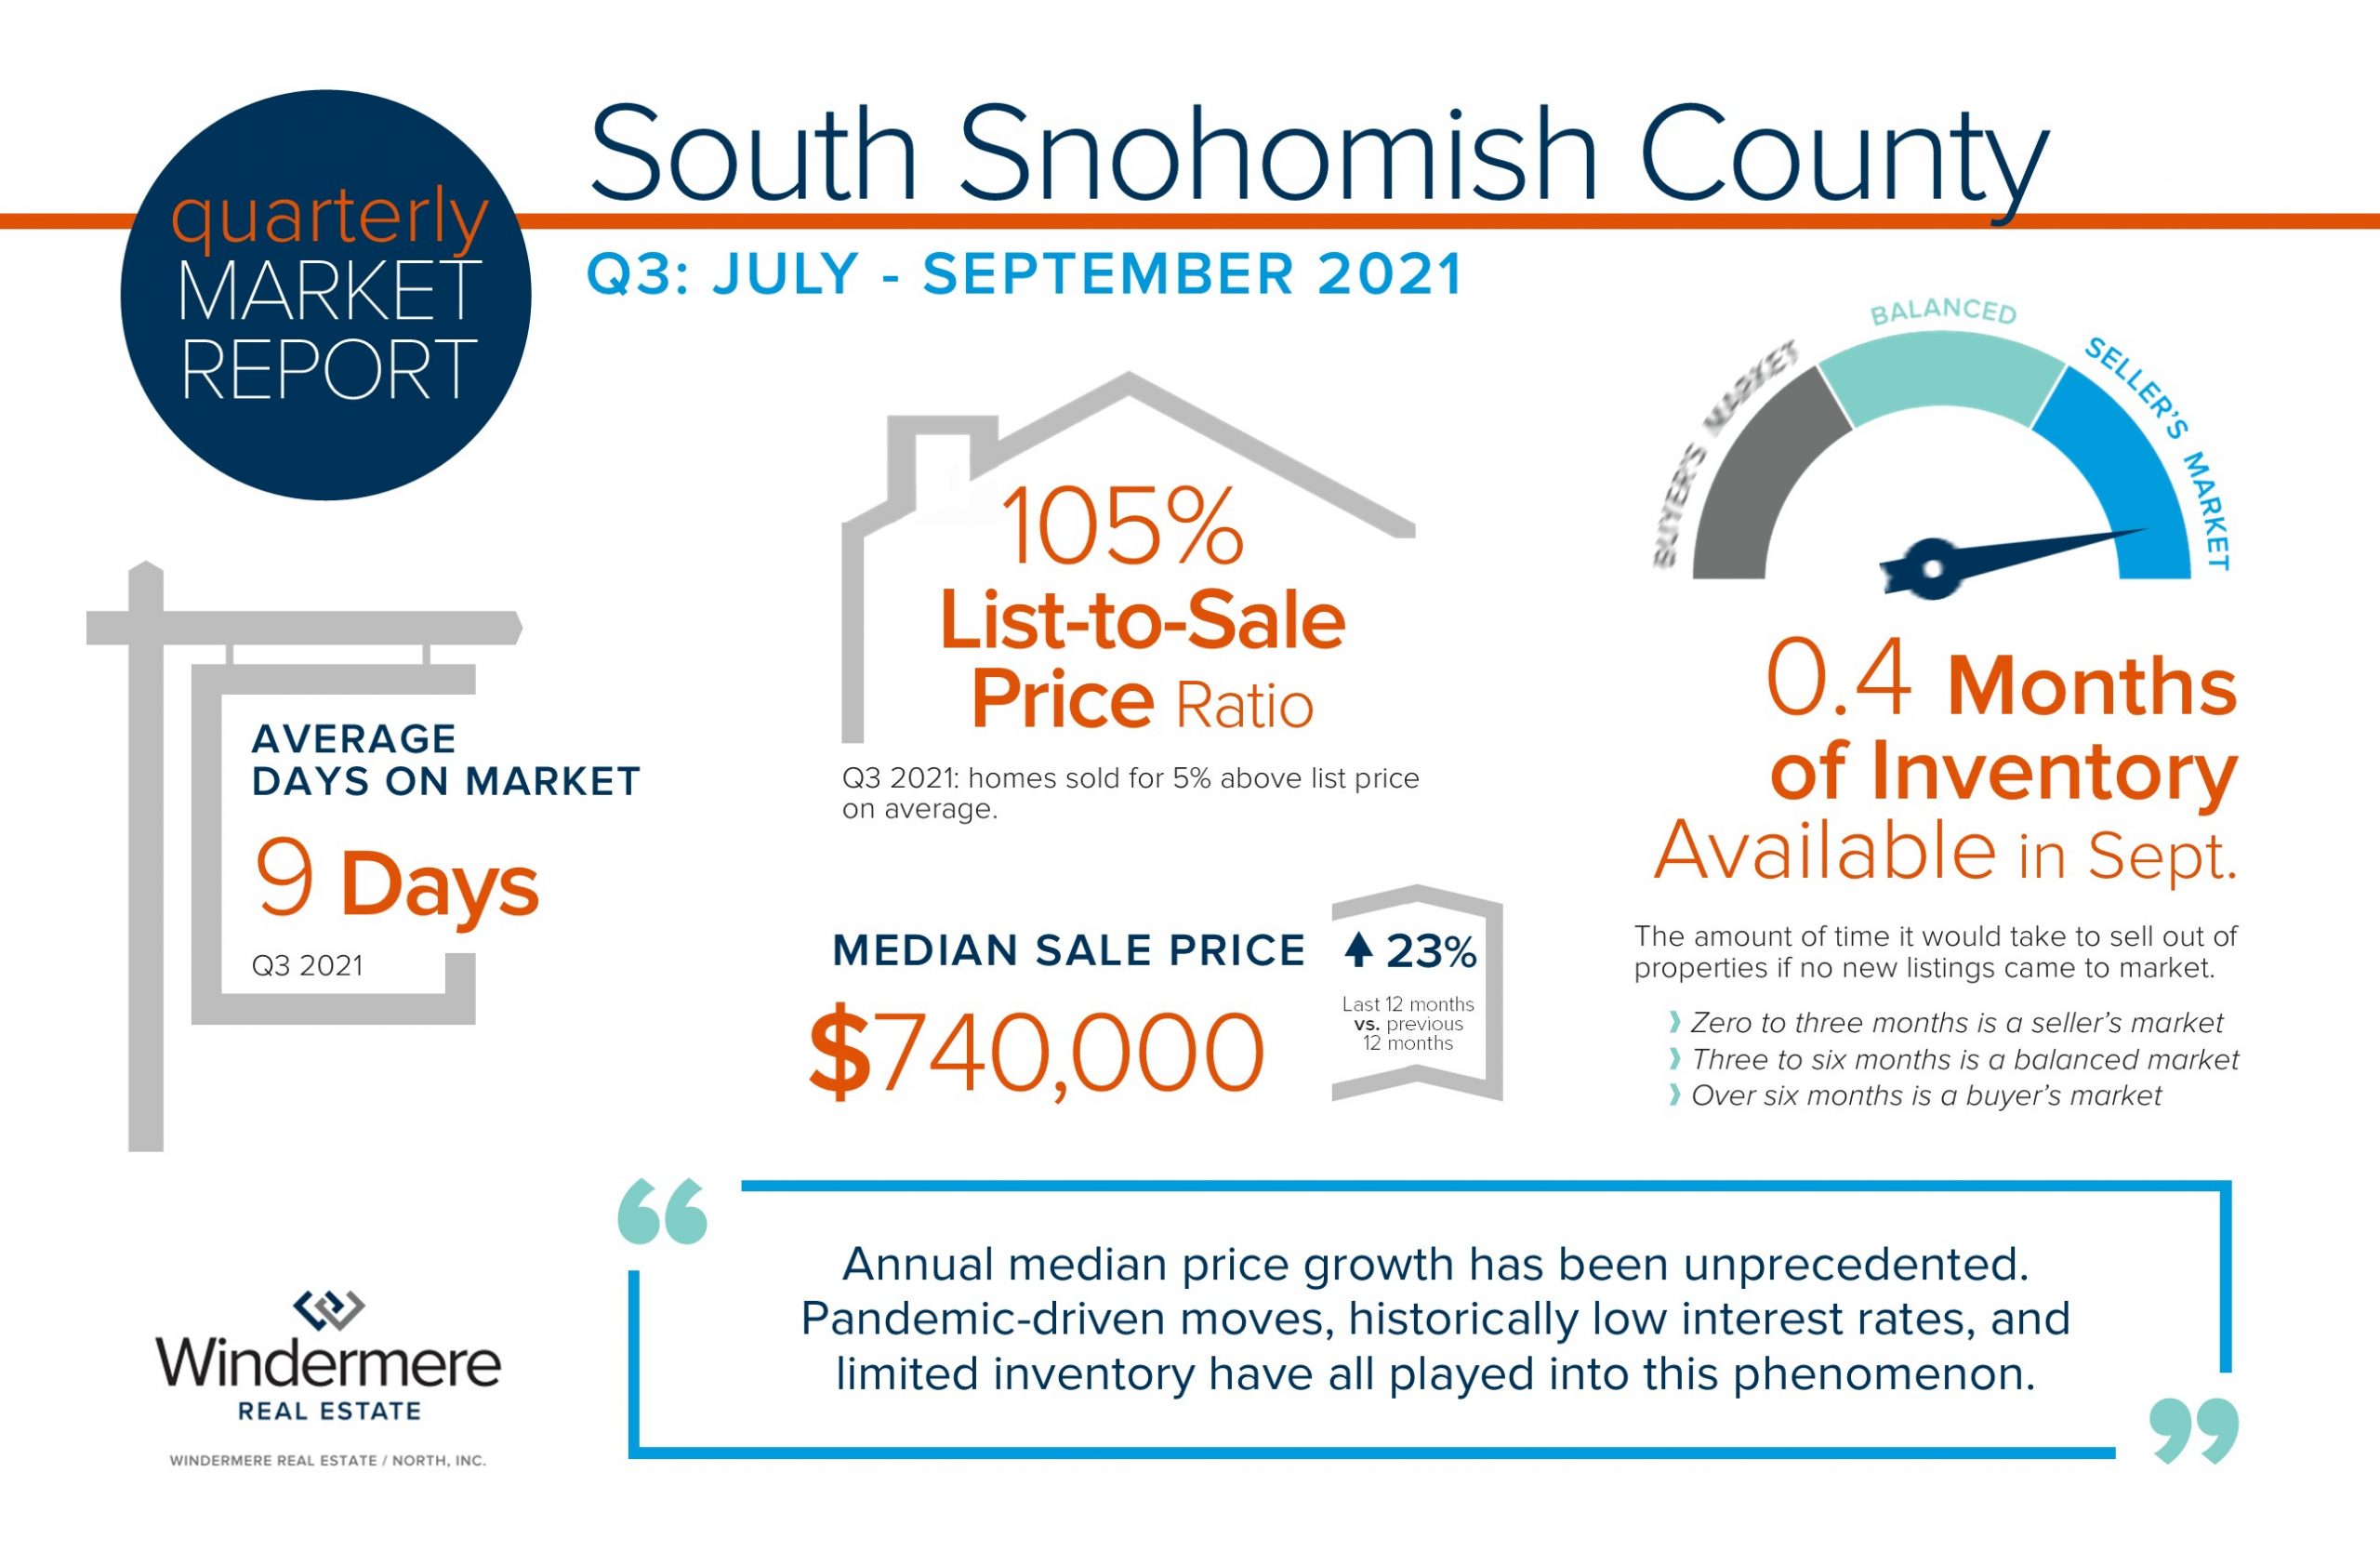
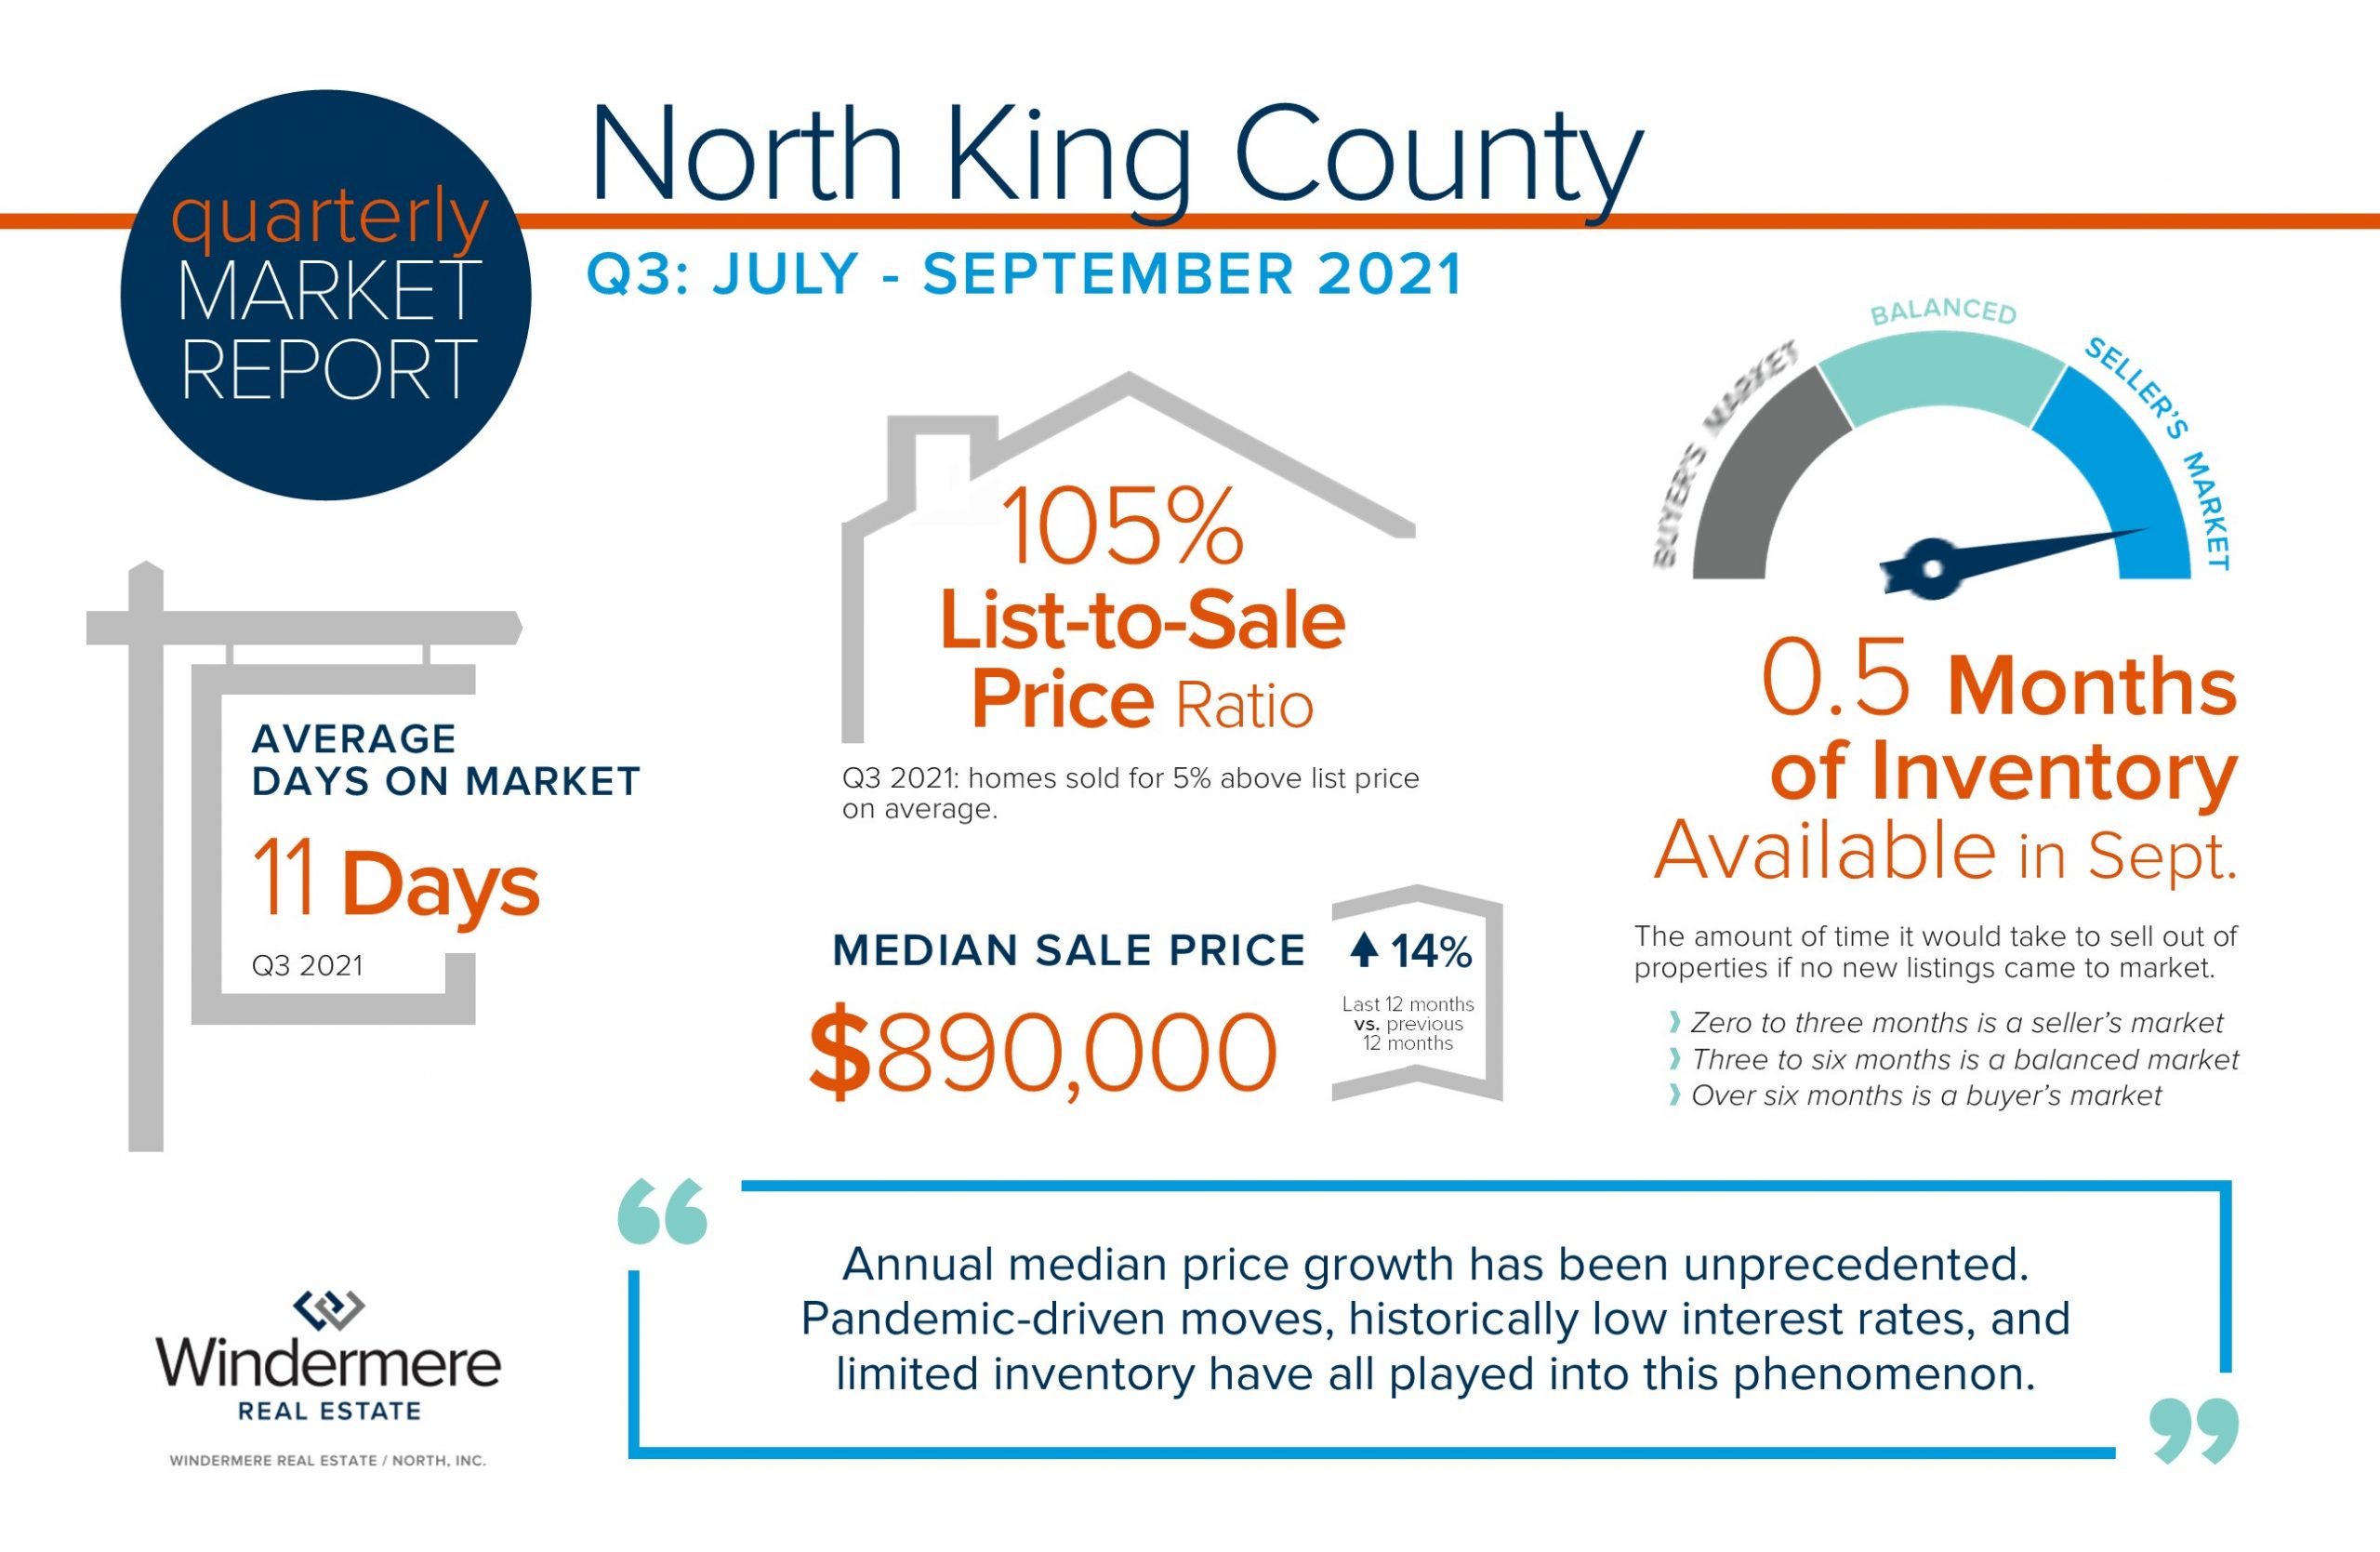
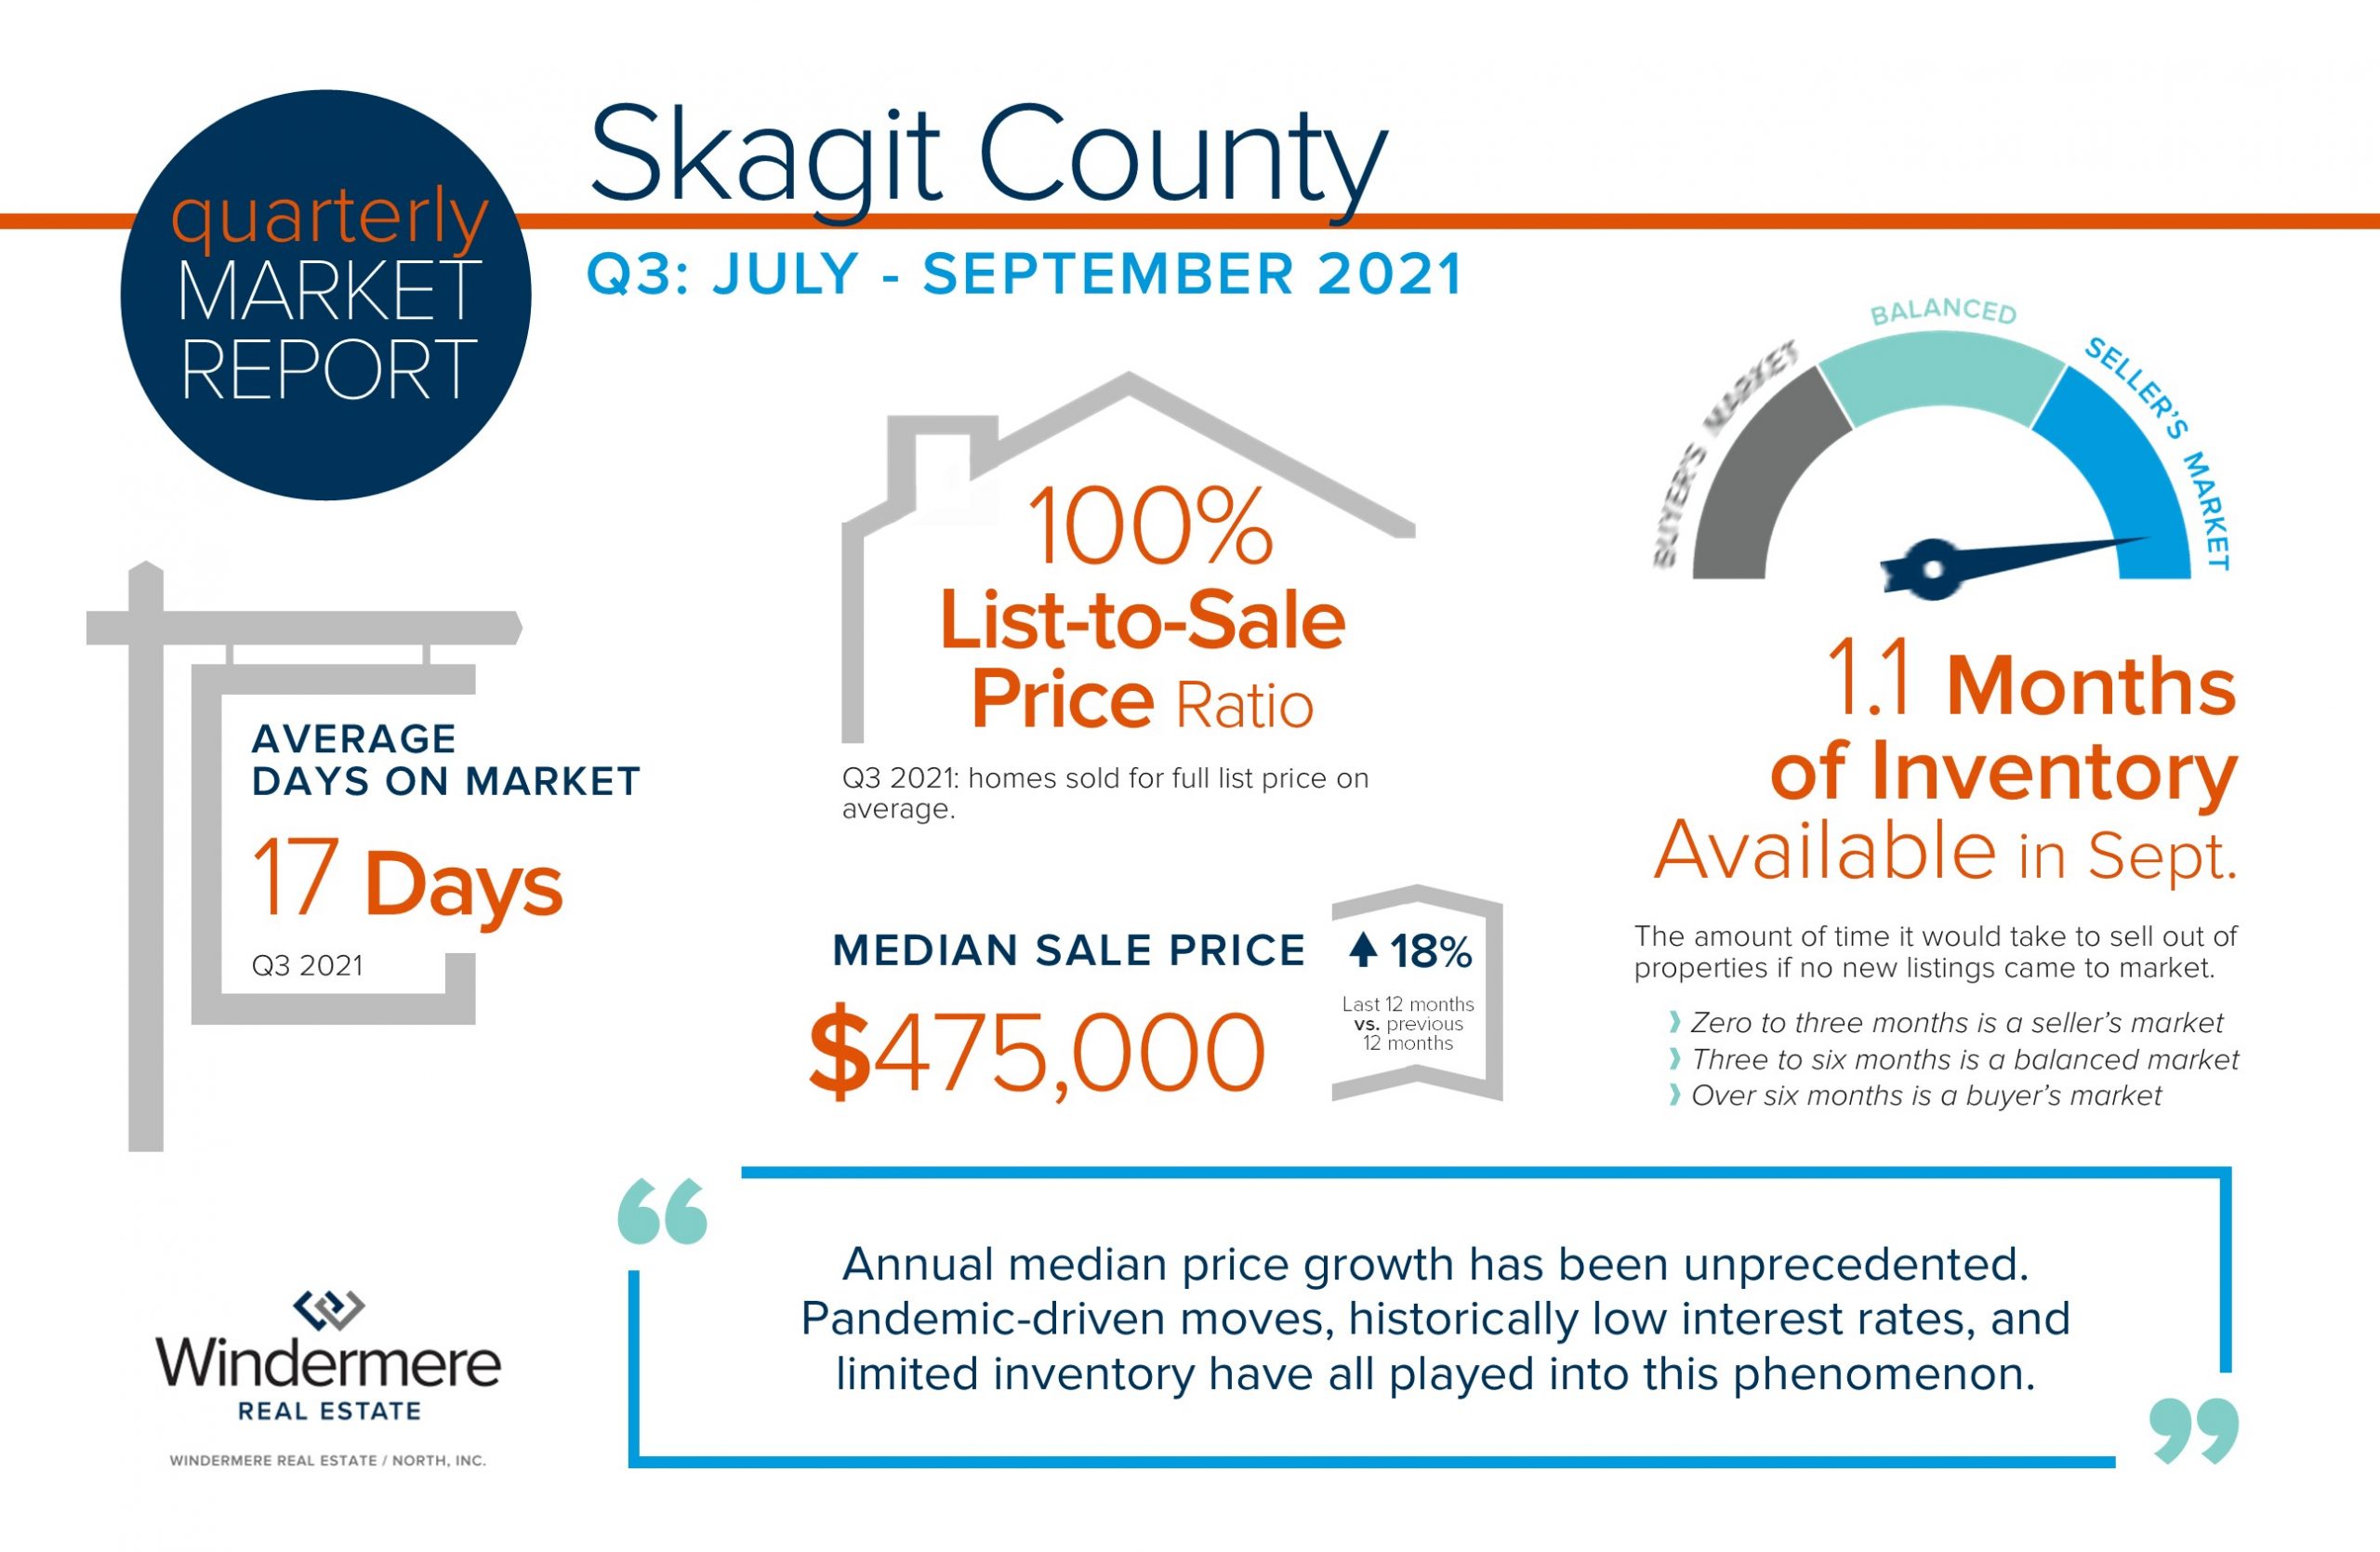
As we start the fourth quarter of 2021, homeowners are sitting on top of a heap of appreciation. Annual median price growth has been unprecedented. Pandemic-driven moves, historically low interest rates, and limited inventory have all played into this phenomenon.
The third quarter saw price growth start to level out as many sellers have stair-stepped their pricing up based on growth in the first half of the year. That has reduced the average list-to-sale price ratios compared to the spring market; however, the average is still over list price. Days on market have also inched up, but continue to be brisk. Inventory has increased some as we find ourselves settling into fall, but demand still abounds with many buyers eager to secure a low interest rate.
You can always count on me to keep you well informed. I am a committed student of the market who continually researches the trends and understands the value of sharing this knowledge to empower strong decisions. Please reach out anytime, it is my pleasure to get your questions answered or help you embark on your next move.
Pumpkin Patches & Fall Activities

Nothing feels more like fall than pumpkin picking, hay rides and corn mazes. Get your latte in hand and head out to any one of these great, local farms to have some harvest fun and find that perfect jack-o-lantern to light up your porch.
Please be sure to verify and take note of each farm’s COVID-19 safety guidelines, as well as any potential weather-related (or COVID-related) closures or changes.
SNOHOMISH COUNTY
Biringer’s Black Crow Pumpkins & Corn Maze
2412 59th Ave NE, Arlington
Bob’s Corn & Pumpkin Farm
10917 Elliott Rd, Snohomish
Carleton Farm
630 Sunnyside Blvd SE, Lake Stevens
Craven Farm
13817 Short School Rd, Snohomish
The Farm at Swans Trail
7301 Rivershore Rd, Snohomish
Fairbank Animal Farm & Pumpkin Patch
15308 52nd Ave W, Edmonds
Stocker Farms
8705 Marsh Rd, Snohomish
Thomas Family Farm
9010 Marsh Road, Snohomish
KING COUNTY
Carpinito Brothers
1148 Central Ave N, Kent
Fall City Farms
3636 Neal Road, Fall City
Fox Hollow Family Farm
12031 Issaquah Hobart Rd SE, Issaquah
Jubilee Farm
229 W Snoqualmie River Rd NE, Carnation
Oxbow Farm
10819 Carnation-Duvall Rd NE, Carnation
Remlinger Farms
32610 NE 32nd St, Carnation
Serres Farm
20306 NE 50th St, Redmond
Thomasson Family Farm
38223 236th Ave SE, Enumclaw
Yakima Fruit Market
17321 Bothell Way NE, Bothell
PIERCE COUNTY
Double R Farms
5820 44th St E, Puyallup
Maris Farms
25001 Sumner-Buckley Hwy, Buckley
Picha’s Farm
6502 52nd St E, Puyallup
Scholz Farm
12920 162nd Ave E, Orting
Spooner Farms
9622 SR 162 E, Puyallup
2021 Year-to-Date Real Estate Market Review

I’ve said it before and I’ll say it again, the 2021 real estate market has been a head-turner! In the second half of 2020, once we started to emerge from the COVID lockdown, the real estate market started to bustle with activity. 2020 ended up being a robust real estate year driven by low interest rates and many COVID-influenced moves due to remote working and retirement. Who would have thought a global pandemic would have such a profound effect on the demand for real estate? Many people decided to retire and exit the state, many people entered our state and exited another, and a large portion of buyers who were no longer anchored by their commute followed their hearts to the suburbs and more rural locations.
When the calendar turned to 2021 the real estate market exploded! Inventory was depleted as 2020 did not provide the normal amount of new listings in tandem with a jump in demand. This combination created price escalations in 2021 that were beyond our wildest imagination. The price points for neighborhoods were re-established almost overnight with benchmark sales elevating the value proposition for the communities in which we live.
Seasonality has always had an effect on the market even in 2021. The first quarter of the year typically has the lowest amount of new listings as sellers make their way out of the short, dark days with soggy yards and projects on their to-do lists to prepare their properties for the spring market. The homes that sold in Q1 2021 saw above-normal gains over the list price. In fact, in Snohomish County, the average list-to-sale price ratio in March was 108%, and in King County 106%. As I mentioned earlier, almost overnight price appreciation established new home values for our communities.
Once the seasonal spring listings started to show themselves and buyers had additional selection, the price gains actually increased! The classic law of supply and demand relates the amount of supply against the amount of demand, and in turn provides a value. In the case of the 2021 spring market, the increase in supply actually was not enough to meet demand and put upward pressure on prices. Recorded sales from March to June saw the highest list-to-sale price ratios peaking at 110% on average in April in Snohomish County and at 108% in May in King County.
 Since January the median price in Snohomish County has increased by 16% and in King County by 17%. Prices peaked in Snohomish County in June with the median price at $700,000 and in July in King County at $875,000. In August, both counties recorded prices 2% off the peak but were still sitting on top of a heap of price growth since the first of the year. Historically, markets will peak in the late spring, early summer as the ceiling of pricing starts to find itself. That appears to be where we are at. Although the figures this year have been intense and well above the norm, it is comforting to see typical seasonality still happening.
There is also this illusion that this type of market environment is easy. Yes, sales happen quickly and demand is high. I would be a fool to say that a sign in the yard and a feature on the internet couldn’t likely get a home sold. I must point out though that this market is nuanced and that obtaining the best results (top dollar and a smooth process) depends on how well all the steps are taken to prepare a property, price-position a property, and how carefully the negotiations and multiple offers are handled along the way by the broker. My office, Windermere North has continued to outperform the market in 2021 with shorter days on market and a higher list-to-sale price ratio than the market average. Check out our YTD comparison to the market averages to help understand how this elevated level of service makes a tangible difference for our clients.
As we head into fall and start to round out 2021, new homes that are coming to market are standing on the shoulders of the sales that took place earlier this year which created these increased home value levels. List-to-sale price ratios are starting to decrease as sellers are stair-stepping their pricing based on the freshly recorded home sales and the market is finding its peak for the year. Sellers that expect to stair-step and to escalate like homes did earlier in the year may find themselves disappointed and overpriced.
We are starting to see market times increase and expect a small surge in fall listings to help satisfy the buyer demand that remains. Low interest rates continue to provide buyers the flexibility to make moves with minimal debt service. As long as rates remain low, demand will continue. The good news is, not every home sale is a multiple-offer frenzy like we saw at the beginning of 2021. The new normal has established itself and buyers are becoming more savvy navigating this market. In my next newsletter, I will outline some expert buyer tools that have helped buyers succeed in this market.
The remainder of 2021 should complete a banner year in real estate. Sellers have made amazing returns and buyers are obtaining homes that better match their lifestyle goals with low debt service. COVID shook up how we value where we live. Remote work increased the value of our suburbs, retirees pushed prices in rural locations, and people having more time to reflect, shifted how they prioritize their homes’ features. Some folks even “got out” of Washington, but it wasn’t a mass exodus, as just as many are leaving other states for ours.
I see this last year and a half as a re-organization of our communities through housing, which comes with some positives and some negatives. Change can be uncomfortable, but change is certain. 2021 has been a year unlike any other! Seasonality, research, and relationships have been the stable markers that have helped me help my clients find success in this new environment and have helped me navigate some occasional choppy waters along the way. It is always my goal to help keep my clients well informed and empower strong decisions. Please reach out if you’d like to learn more about how the current market relates to your goals. If you know of anyone who needs real estate help, I would be honored to help take care of them as well.
All of us at Windermere Real Estate are proud to kick off another season as the “Official Real Estate Company of the Seattle Seahawks.” Since 2016, we’ve partnered with the Seahawks to #TackleHomelessness by donating $100 for every Seahawks defensive tackle made in a home game. And for the third season in a row, the money raised will go to Mary’s Place, a non-profit organization dedicated to supporting homeless families in the greater Seattle area. Mary’s Place works to provide safe and inclusive shelter and services that support women, children, and families through their journey out of homelessness.
Mary’s Place’s mission and the work of the Windermere Foundation go hand-in hand. At the last home game, we were able to donate $6,300, which brought our #TackleHomelessness total to $166,600 adding to our donations over the past five seasons. We look forward to raising even more this year!
Go Hawks!
Newsletter – Q2 Gardner Report & Summer Food Drive Recap

At Windermere, we are fortunate to have Matthew Gardner as our Chief Economist. In fact, we are one of the only real estate companies in the country to have such a well-respected expert sitting in this role. Not only is Matthew an asset to Windermere brokers and their clients, but he is a coveted resource within the industry. He is often called upon by major media outlets and industry think tanks for his insights.
Every quarter Matthew produces The Gardner Report which re-caps various statistics and predictions for all of Western Washington. What is so great about this is you can read about where you live and also get a glimpse into other markets that may pique your interest.
Read the full Western Washington report here. Additionally, since Windermere spans the entire Western Region of the United States, he also provides this same report for Washington (Western, Central & Eastern), Oregon, Idaho, California (Southern & Northern), Utah, Colorado, Nevada, and Hawaii (Maui & the Big Island).
There has been a lot of state-to-state moves over the last few years. Many of these moves have been prompted by retirement, second home purchases, and remote working due to COVID changes to the workforce. This is a great way to research other markets you may be interested in. Also, I am connected to the Windermere network of brokers and can easily find you a reputable broker who would be a stellar match for your real estate needs outside of my normal market area.
Further, I am also a part of a national and international network of real estate companies for referrals outside of the Windermere footprint. This is through Windermere’s affiliation with Leading Real Estate Companies of the World. Bottom line, I can help provide information and can help align you with a trusted real estate advisor anywhere in the world. Please reach out of I can help!
Huge thanks to everyone who donated to my office’s Summer Food Drive! Collectively we provided 2,608 meals for our neighbors in need! We presented a check for $3,400 and 888 pounds of food to the Volunteers of America Western Washington food banks last week, and that’s all because of you! Thank you!
8 Ways to Make Back to School Easier

The first day of school sneaks up so fast… summer is here and then gone in a flash! Whether your child is anxious or excited about the start of a more “normal” school year, here are some practical tips to help start things off on the right foot.
Start talking about it. New teacher, new classmates, new schedules can all create some anxieties with kids. Start talking about school a few weeks before the first day. Talk about practical things like what the new schedule will be like and what the school’s COVID policies are, but also make sure to address their feelings and concerns about the upcoming year.
Go back to school shopping early. Take advantage of your summer schedule to shop while the store isn’t as busy and the supplies haven’t been picked through. Don’t forget to buy extras for homework time or the winter re-stock that inevitably happens in January.
If you have the means to, also consider reaching out to your child’s teacher and ask if they have a Wish List that you can help with. Most teachers have very real material needs that go beyond their classroom supply lists, and now more than ever, our teachers need our kindness, our support and our advocacy.
Determine how your child will get to and from school and practice the route.
Ease back into the scheduled days. When you and your kids are used to lazy mornings and staying up late, shifting to the early morning school bus rush can be incredibly difficult. To ease the transition, start 7-10 days before school starts, and shift bedtimes and wake-up times gradually. Every day, start their bedtime routine 10-15 minutes earlier and wake them up 10-15 minutes earlier until they’re back on track. And don’t forget to readjust your bedtime schedules, too!
Re-set eating habits. When school starts, your student’s eating patterns need to maintain a high level of energy throughout the day. Implementing a routine for breakfast, lunch and snacks is just as important as their sleeping patterns. Begin this transition 7-10 days before school starts as well.
Sync your calendars. Add the school calendar to your personal/family calendar, so important dates like parent-teacher night aren’t missed.
Set rules for after school. After-school time and activities such as TV, video games, play time, and the completion of homework should be well-thought out in advance. Talk about the rules (and consequences) for these before school starts.
Prioritize mental health. Encourage your child to speak up if they are struggling, and remind them that their school counselors are there to help. Remember that often, being proactive with our mental health can be just as important as with our physical health. Setting up a few appointments with a counselor or therapist for the first weeks or months of school might be just the preventative help that your child needs. Or maybe just start looking into outside help options now, so that you are prepared if your child needs it later during the school year.
South King County Quarterly Market Reports Q2 2021
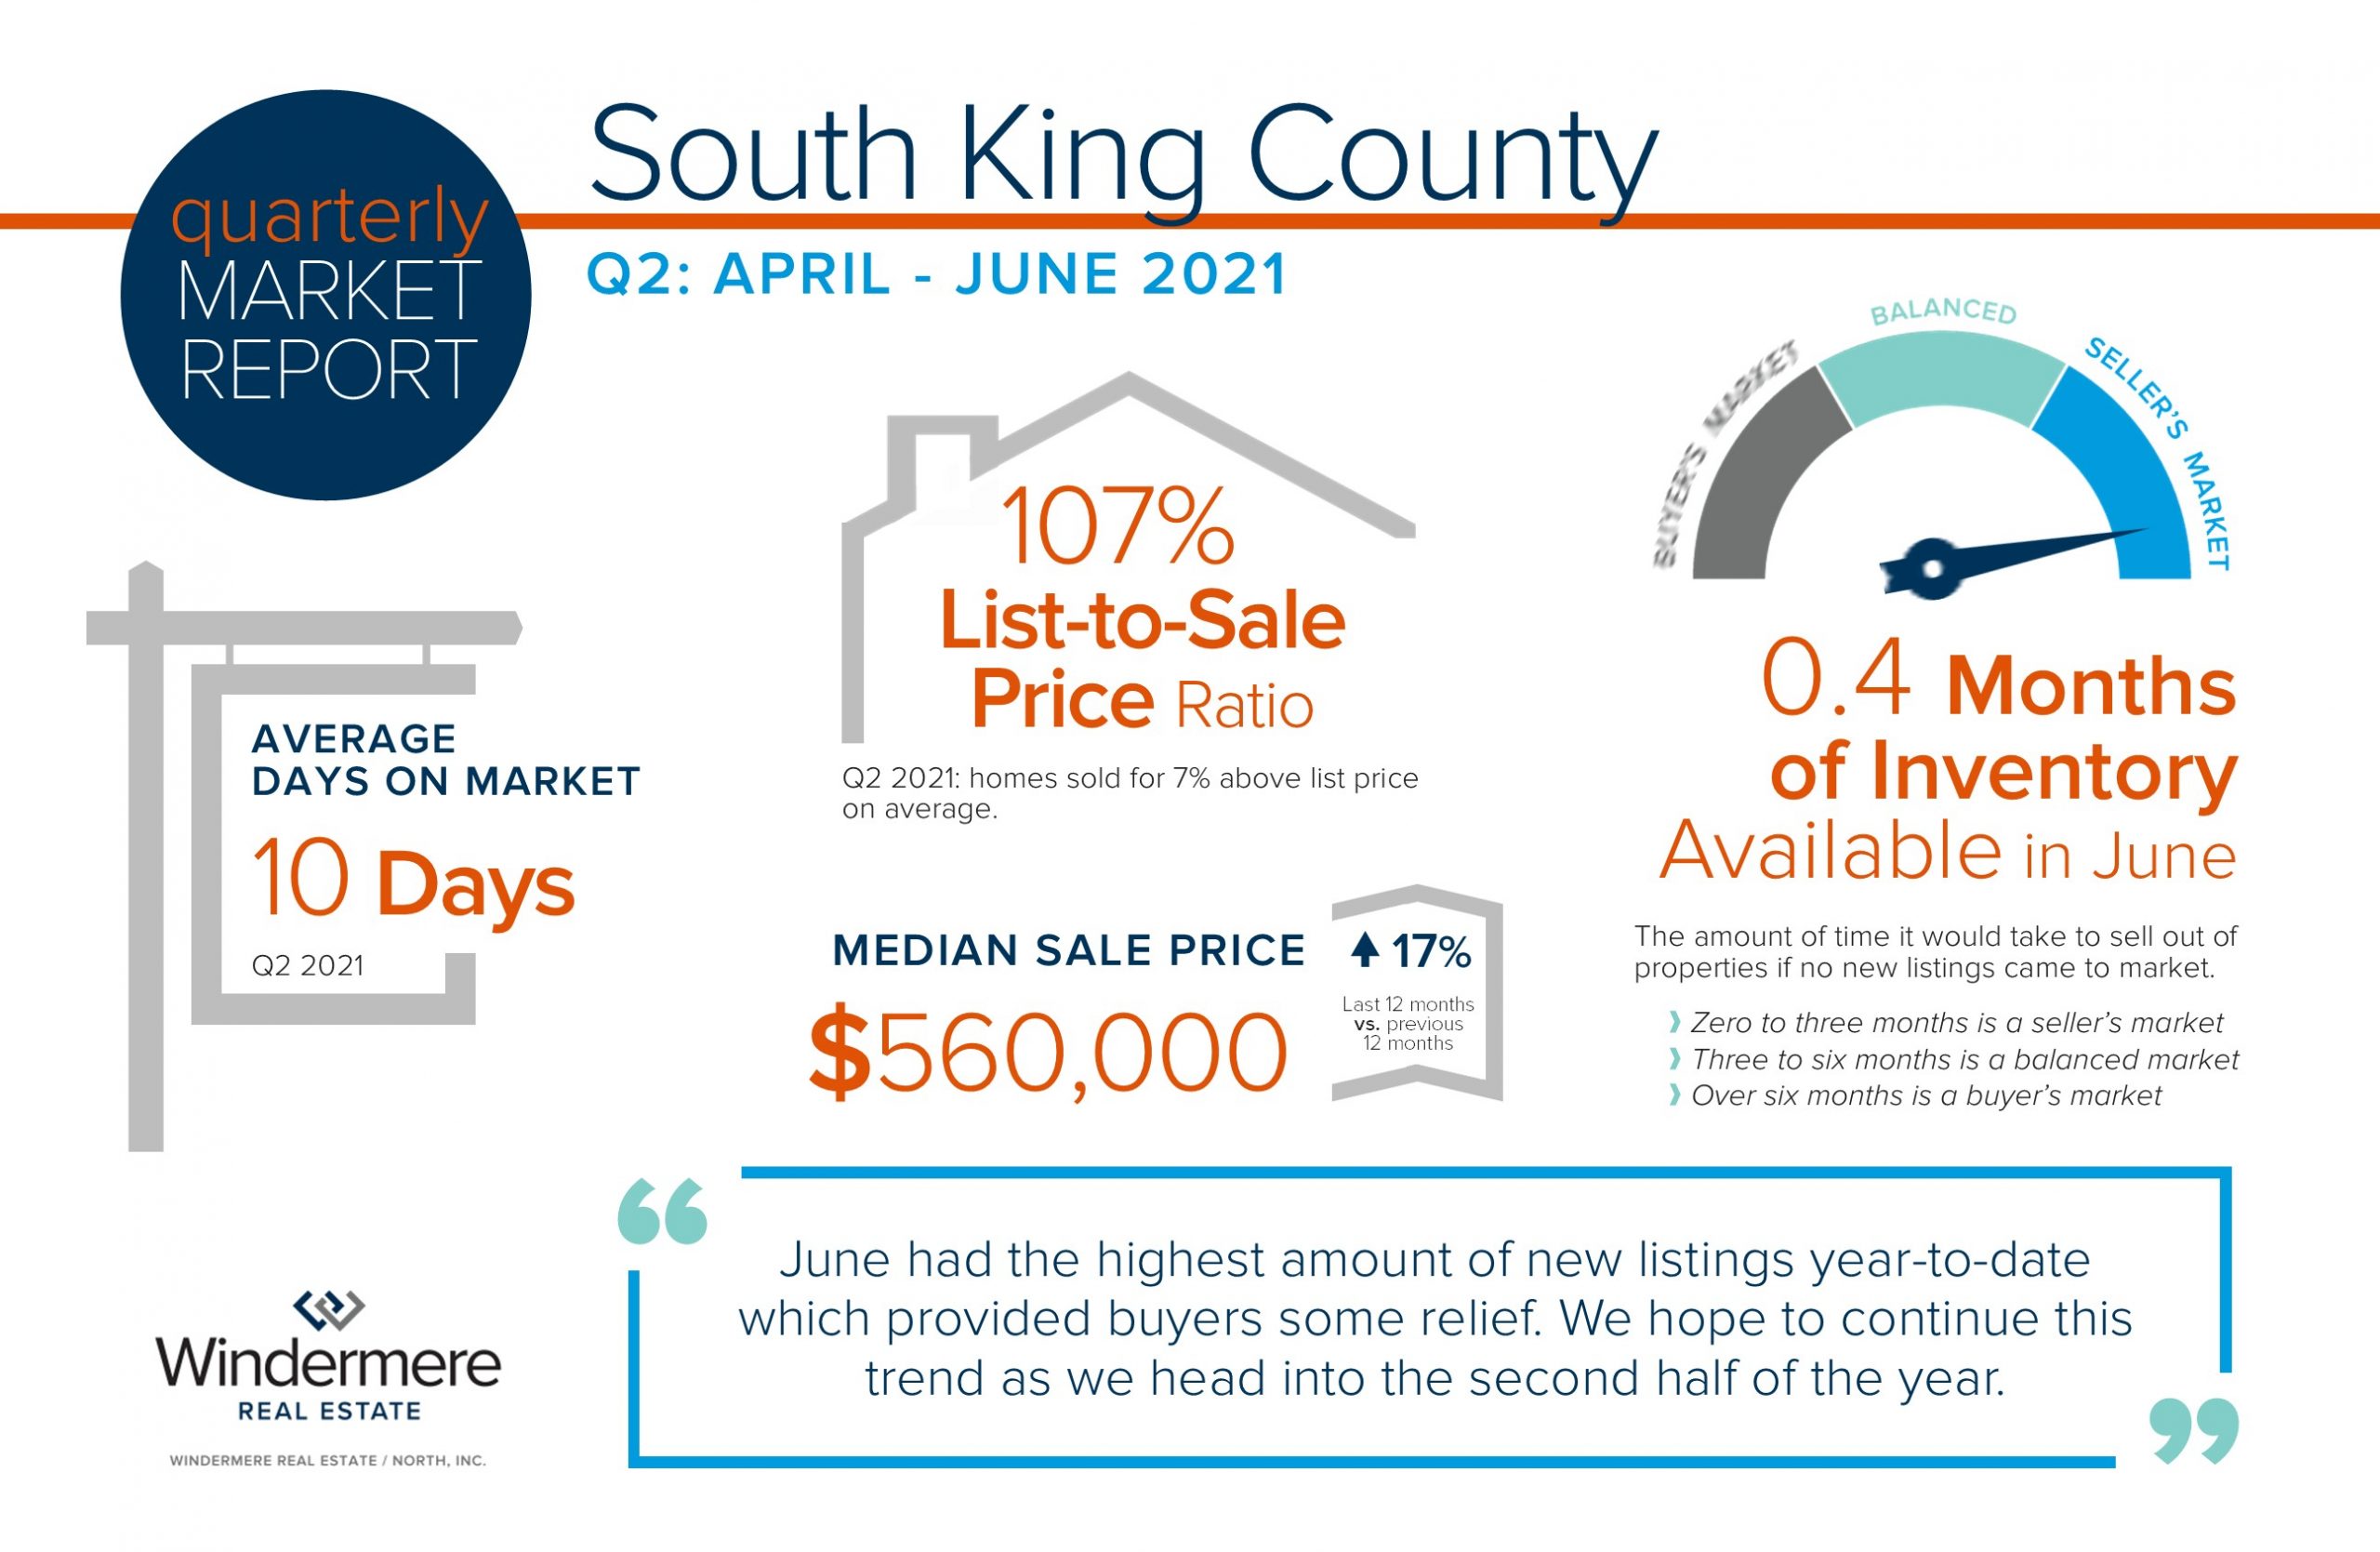
The 2021 real estate market continues to be hot! Tight inventory has been a result of intense buyer demand fueled by historically low interest rates and the lucrative tech industry in our area. Also, moves brought about by the COVID effect of remote work options and some people moving towards retirement have brought additional buyers to the marketplace.
New listings are actually up from last year, but buyer demand continues to absorb the selection. This has caused above-average year-over-year price appreciation in the double digits. June had the highest number of new listings year-to-date which provided buyers some relief. We hope to continue this trend as we head into the second half of the year.
If you would like to know more about how today’s real estate market applies to your financial and lifestyle goals, please reach out. It is always my goal to help keep my clients well informed and empower strong decisions.
North Snohomish County Quarterly Market Reports Q2 2021
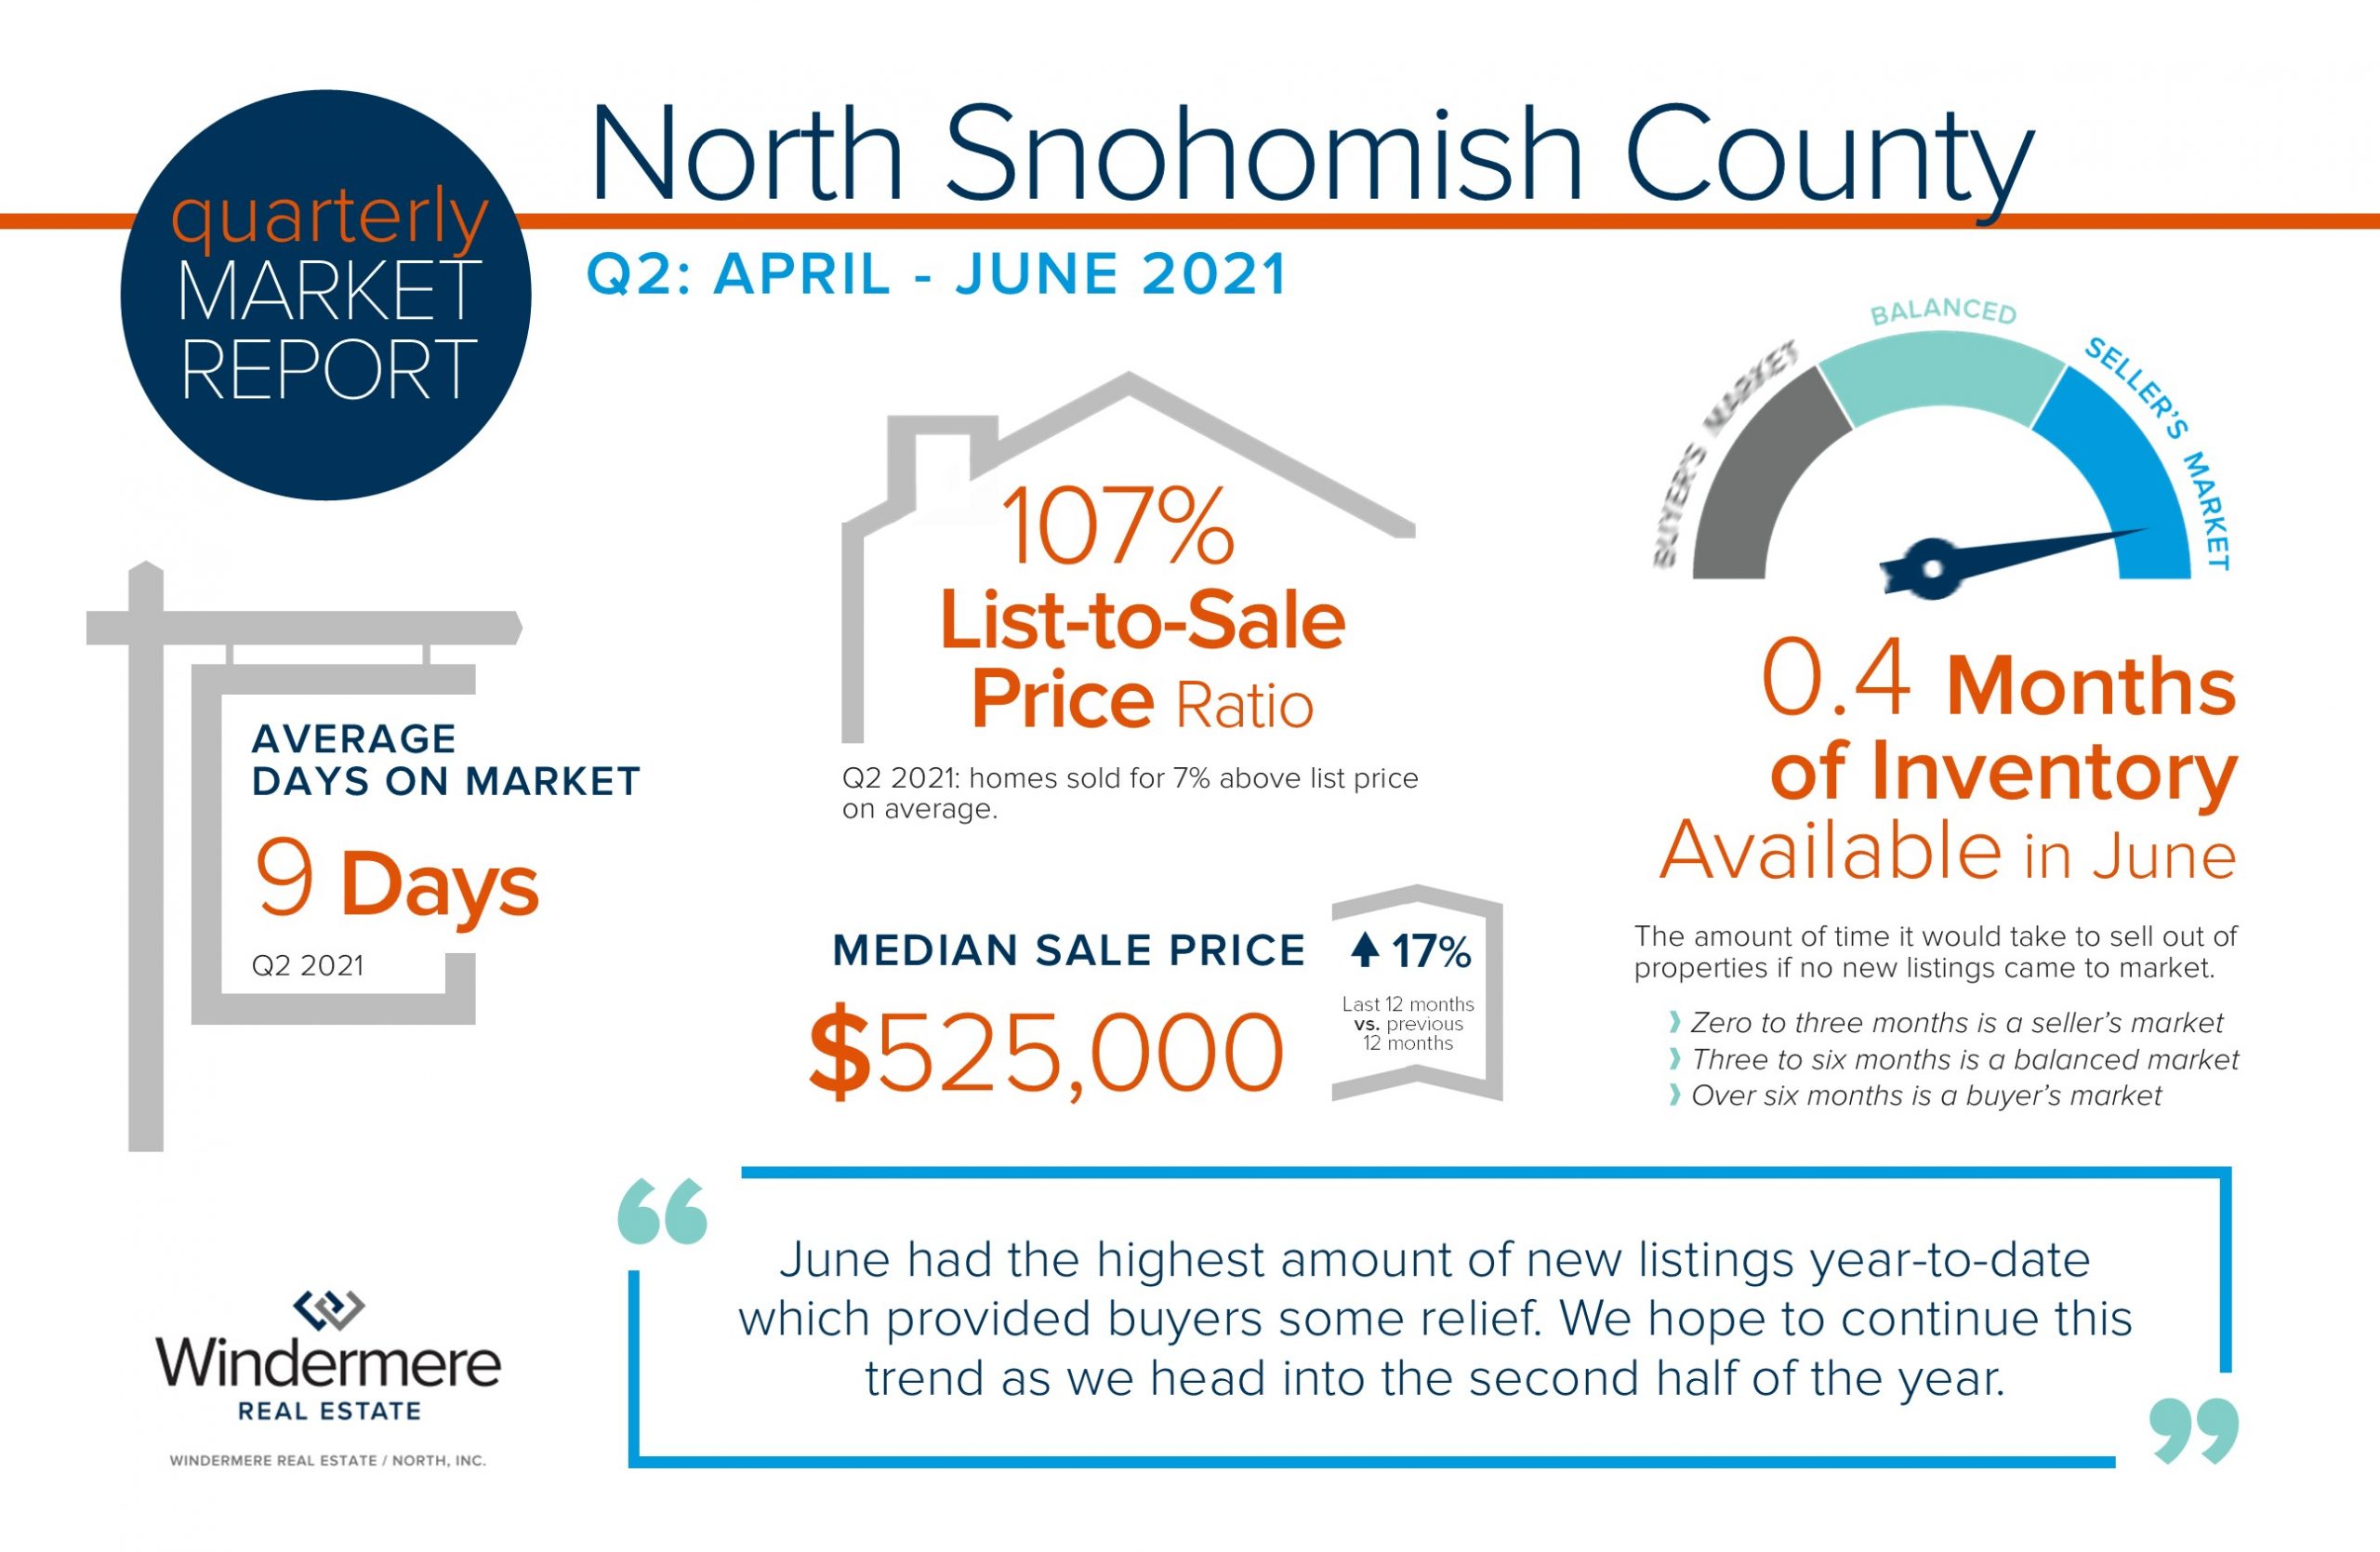
The 2021 real estate market continues to be hot! Tight inventory has been a result of intense buyer demand fueled by historically low interest rates and the lucrative tech industry in our area. Also, moves brought about by the COVID effect of remote work options and some people moving towards retirement have brought additional buyers to the marketplace.
New listings are actually up from last year, but buyer demand continues to absorb the selection. This has caused above-average year-over-year price appreciation in the double digits. June had the highest number of new listings year-to-date which provided buyers some relief. We hope to continue this trend as we head into the second half of the year.
If you would like to know more about how today’s real estate market applies to your financial and lifestyle goals, please reach out. It is always my goal to help keep my clients well informed and empower strong decisions.
Seattle Metro Quarterly Market Reports Q2 2021
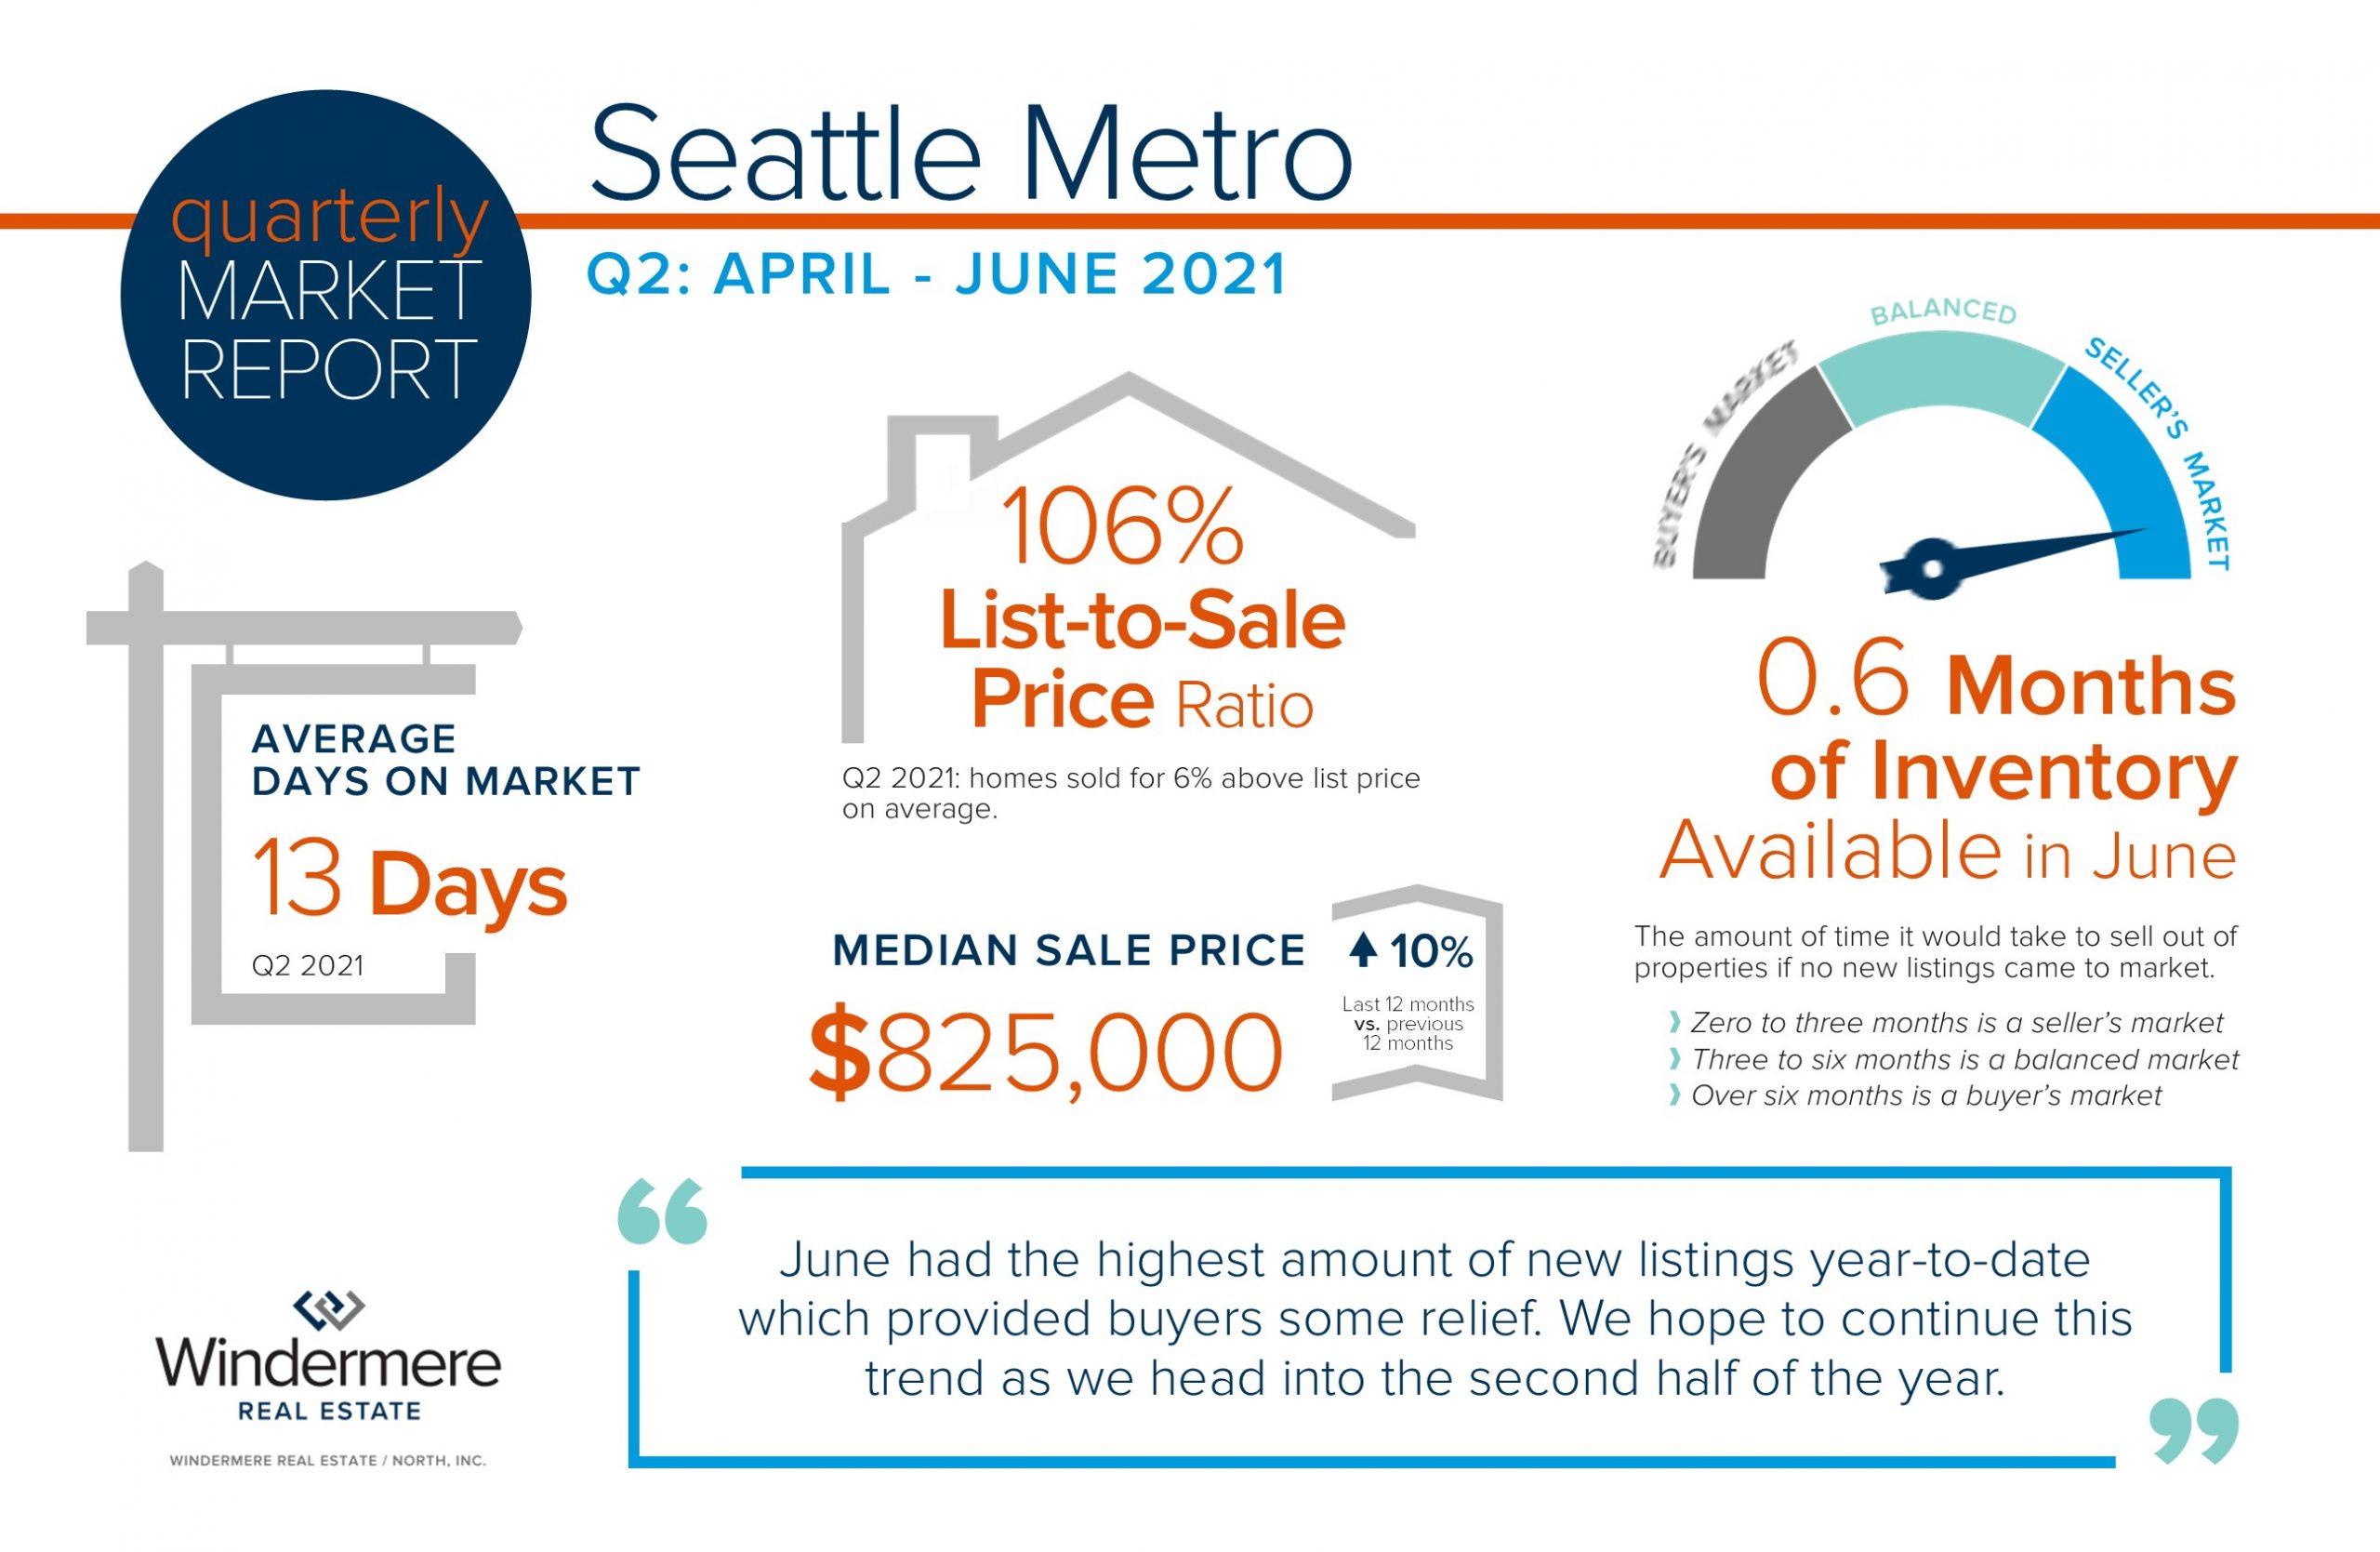
The 2021 real estate market continues to be hot! Tight inventory has been a result of intense buyer demand fueled by historically low interest rates and the lucrative tech industry in our area. Also, moves brought about by the COVID effect of remote work options and some people moving towards retirement have brought additional buyers to the marketplace.
New listings are actually up from last year, but buyer demand continues to absorb the selection. This has caused above-average year-over-year price appreciation in the double digits. June had the highest number of new listings year-to-date which provided buyers some relief. We hope to continue this trend as we head into the second half of the year.
If you would like to know more about how today’s real estate market applies to your financial and lifestyle goals, please reach out. It is always my goal to help keep my clients well informed and empower strong decisions.
 Facebook
 X
X
 Pinterest
 Copy Link

