
 Facebook
 X
X
 Pinterest
 Copy Link

 This year, we collectively donated $16,125 for these camp scholarships. With a
The generational shift that is happening in our country right now is having a strong influence on demand for real estate. As the Millennials gain a stronger foothold into their adulthood, Generation X settles in with family, Boomers move towards retirement and the Silent Generation find themselves making moves for health reasons, the desire to match their homes to the time in their life is creating strong demand in the real estate market.
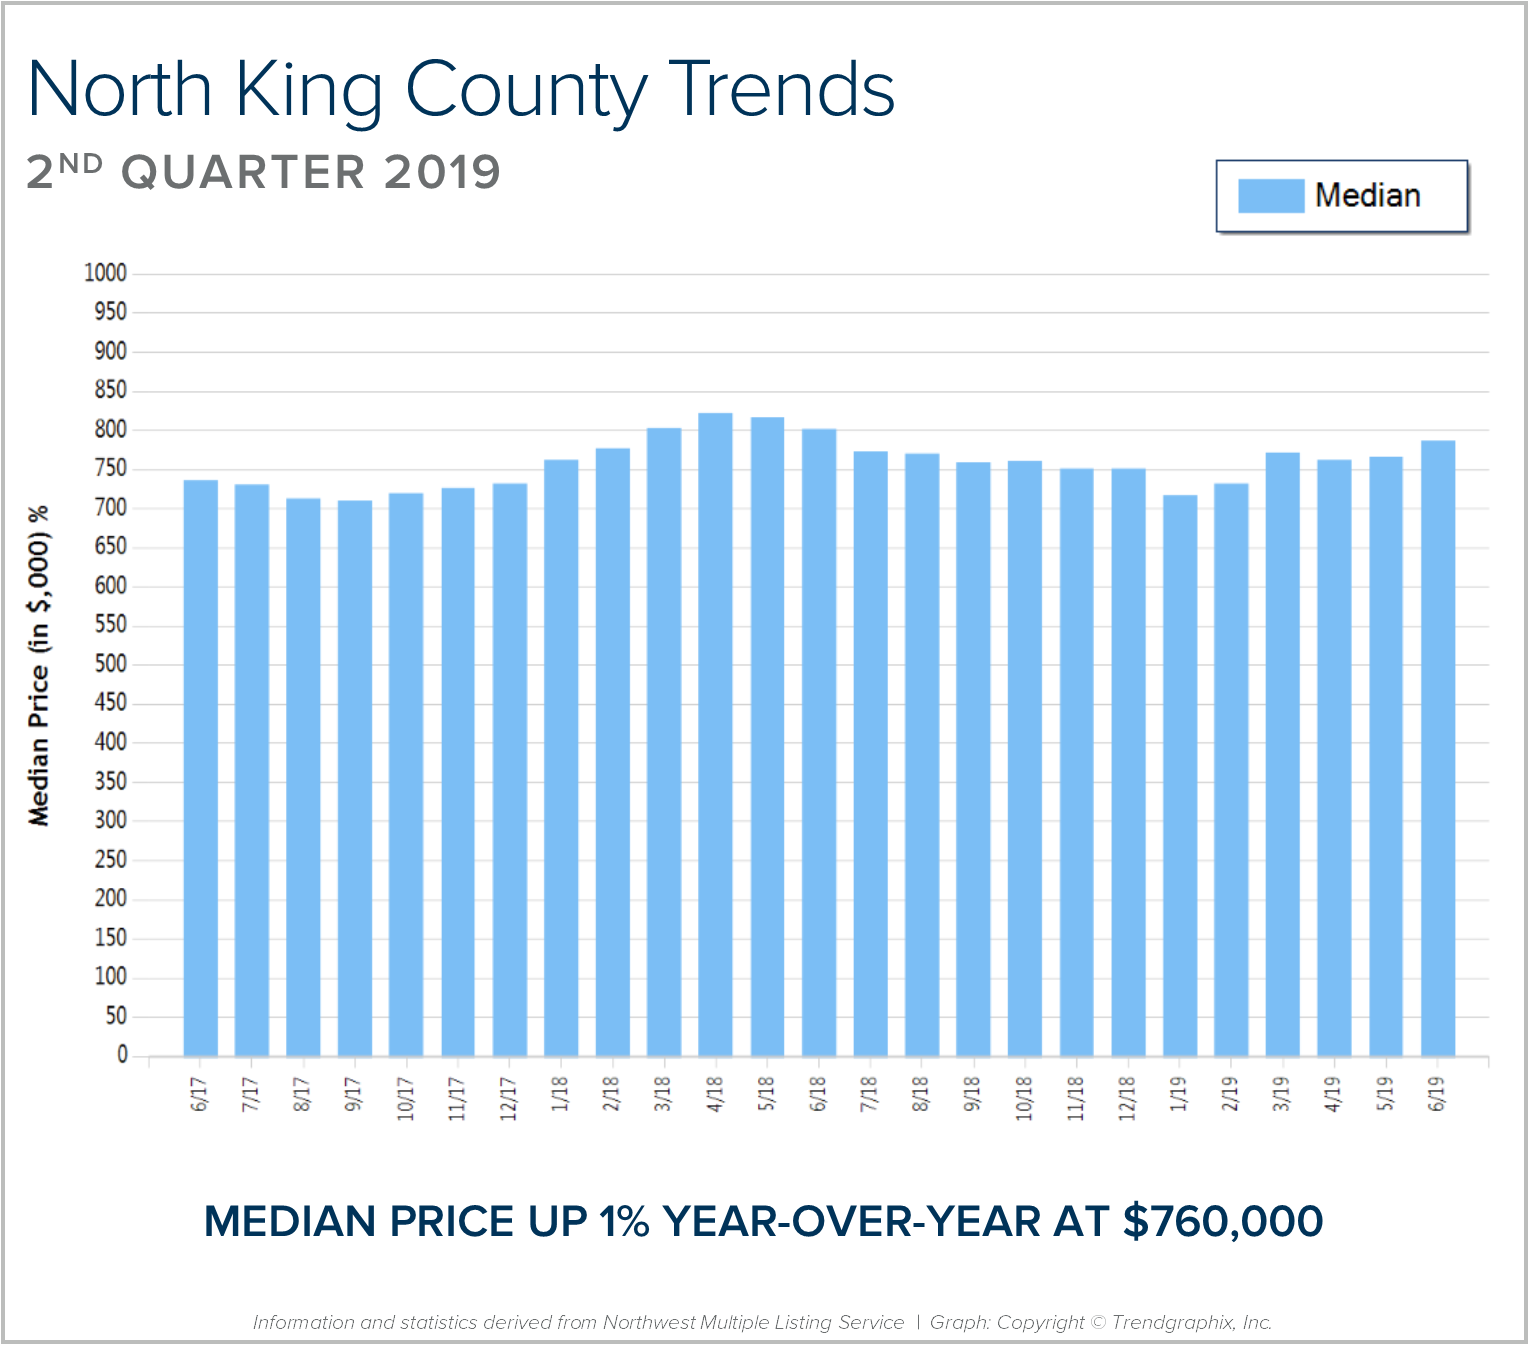
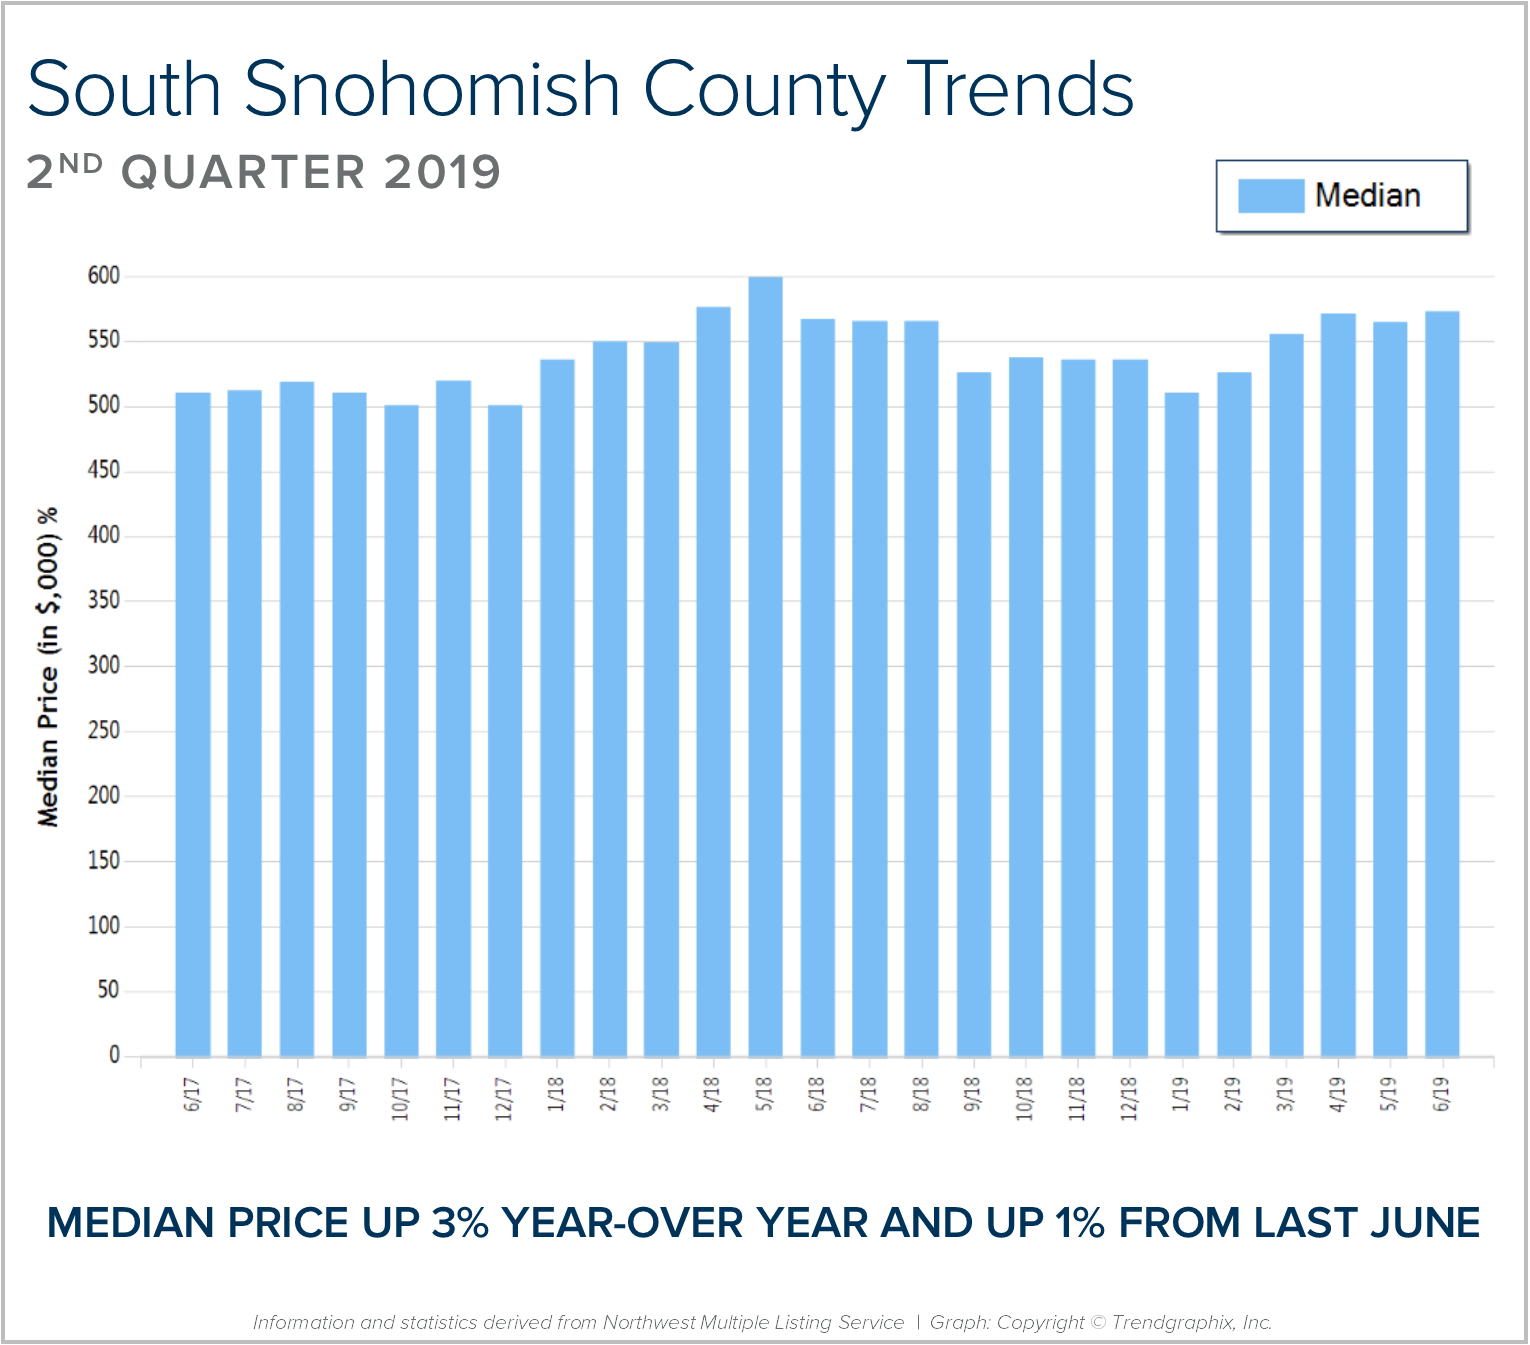
In the month of April, the absorption rate based on pending sales was 81% in north King County and 91% in south Snohomish County. Historically low interest rates are helping to fuel this demand. In fact, rates are over half a point lower than they were six months ago. The low rates are enabling people to make moves with less debt service to satisfy their changing needs for housing based on their age and lifestyle. Below you can see a chart from the National Association of Realtors outlining this motivation.
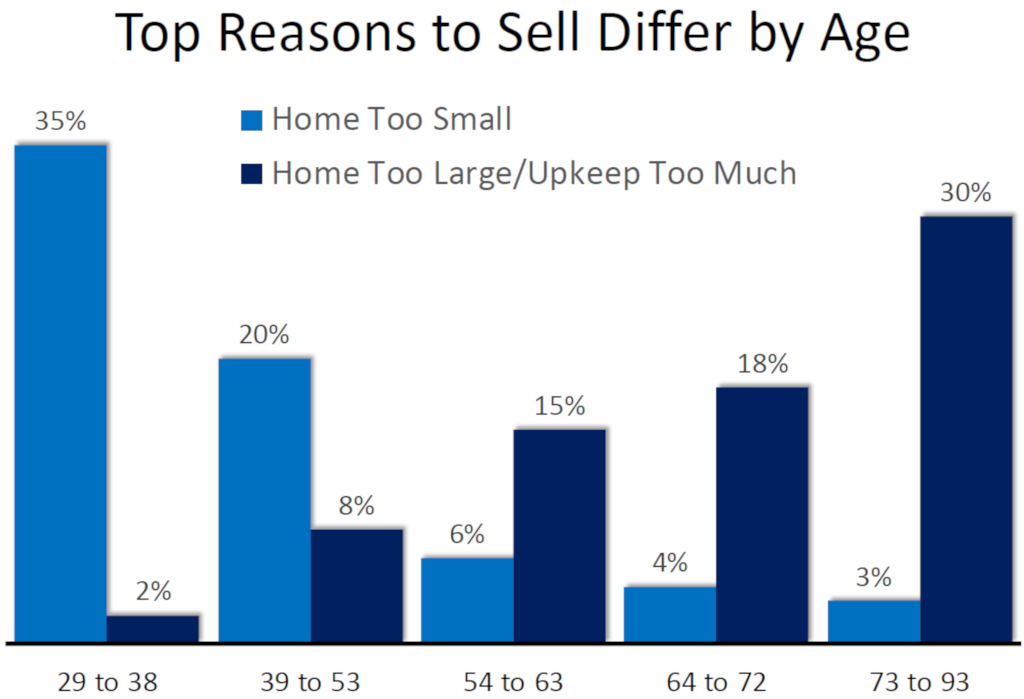
Recently, the National Association of Realtors did a survey of home buyers to help understand the generational influence on real estate. From July 2017 to June 2018 they gathered data which outlined the top motivators for each age group. Let’s take a look at what caused these groups to make moves.
Young Millennials (1990-1998)
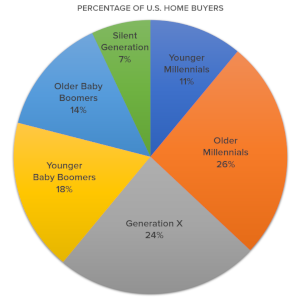
This group accounted for 11% of all home buyers and were predominantly first-time home buyers. Motivated by the desire to start building wealth through owning real estate and purchasing as close to work as possible, this group enjoyed small ramblers, townhomes and condos. This group used financing to obtain their purchases and used savings or gift funds to amass their down payment. A common misconception from this group is that they need a large down payment in order to purchase. This group utilized loan programs with smaller, single-digit down payments to help get their foot in the door of becoming a home owner and building wealth.
Older Millennials (1980-1989)
This group accounted for 26% of all home buyers, the largest group! They have become more established in their careers and are getting married and having children, which is creating the need for a larger home. They tend to gravitate toward larger homes and are willing to move a bit further away from work to obtain the larger square footage. This group is moving into the suburbs and considering school districts and commute times. Some were able to move equity from their first home to the next, creating a larger down payment; others bought for the first time to avoid high rents.
Generation X (1965-1979)
This group accounted for 24% of all home buyers, the second largest group. They are motivated to upgrade to the largest square footage of all, and take a multi-generational approach to their housing. Many with aging children and/or parents, it is not uncommon for this group to consider having room for adult children or older parents. Still in prime earning years, proximity to work is very important. Positive equity positions have helped this group make these transitions.
Younger Boomers (1955-1964)
This group accounted for 18% of all home buyers. Job change and desire to be closer to friends and family motivated this group. Positive equity growth enabled some of this group to have sizable down payments. Another interesting fact about this group is that one in four were a single female, some of which were first-time home buyers. In some cases divorce and death lead individuals to still take on home ownership to build wealth and avoid high rents.
Older Boomers (1946-1955)
This group accounted for 14% of all home buyers. The ability to move equity from one home to the next was a huge influence for this group, and enabled them to find that “forever home” with large down payments and in some cases with “all cash”. The house with less maintenance, more upgrades, possibly further away from job centers, but still close to family and friends. Single level living is of high priority for this group along with turn-key finishes.
Silent Generation (1925-1945)
This group accounted for 7% of all home buyers and often centered themselves in senior living choices. Smaller homes or condos with stair free access in communities close to family and health services are a priority for this group. Through years of equity growth many of these purchases are “all cash” or only with the need for a very small mortgage.
Life changes motivate real estate decisions. Career changes, marriage, divorce, family size, retirement, and the desire to be close to family and friends are just some of the reasons people decide to make moves. Fortunately, today’s low interest rates and the ability to transfer equity from one property to another is having a positive effect on demand for real estate. The recent balancing of the market due to more inventory has also made it a bit easier for first-time home buyers to purchase a home.
If you’re curious about the market and how your goals, current lifestyle, and financial position measure up, please contact us. We can help you analyze your ability to match your home to your life. It is our goal to help keep you informed and empower strong decisions.

We are collecting vegetable seeds and starts for the Martha Perry Garden, where volunteers grow thousands of pounds of fresh produce every year for local food banks.
Our office will be spending a volunteer day in the garden for our annual Community Service Day in June. In addition to our labor, we will gift them all of the vegetable seeds and starts collected between now and then.
All seeds should be no more than a year old, although fresh seeds are preferred.
Wish List:
Basil, Beets, Cabbage, Carrots*, Cauliflower, Chard, Cucumbers, Green Beans, Herbs, Marigolds, Peppers, Radishes, Summer Squash, Snow Peas, Tomatoes, Winter Squash, Zucchini
*High Demand!
Starts of cucumbers, winter & summer squash, cole crops (cabbage, cauliflower, broccoli, kale, etc) are especially welcome
Thank you!!

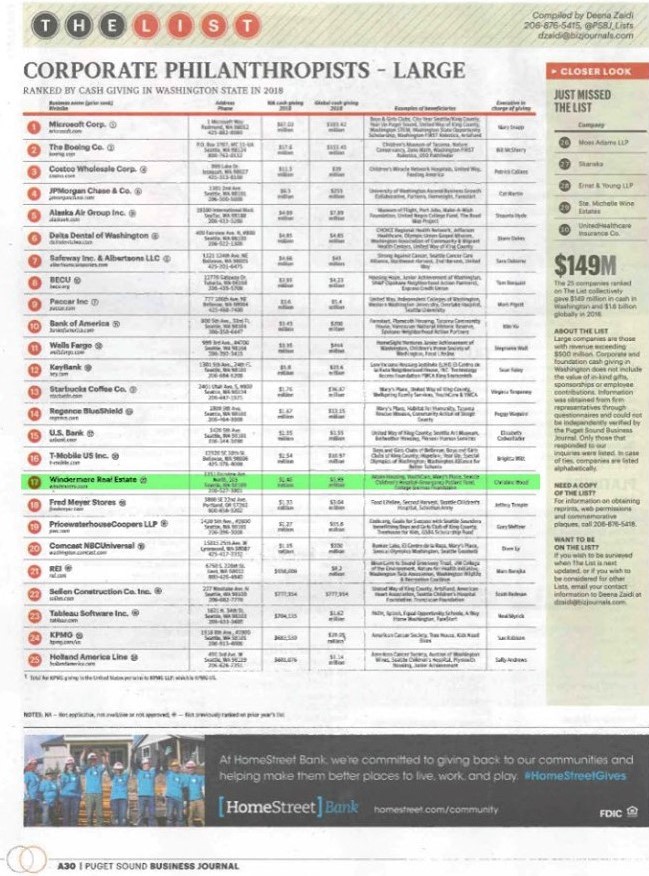
The Windermere Foundation was recognized last week, along with 74 other generous companies, at the annual Puget Sound Business Journal’s Corporate Philanthropy luncheon. The Windermere Foundation moved up the list (and it’s a very impressive list, full of national and international companies!) from #22 to #17!
Check out WindermereFoundation.com for more info on our culture of giving back.

 We are pleased to present the first-quarter 2019 edition of the Gardner Report, which provides insights into select counties of the Western Washington housing market. This analysis is provided by Windermere Real Estate Chief Economist



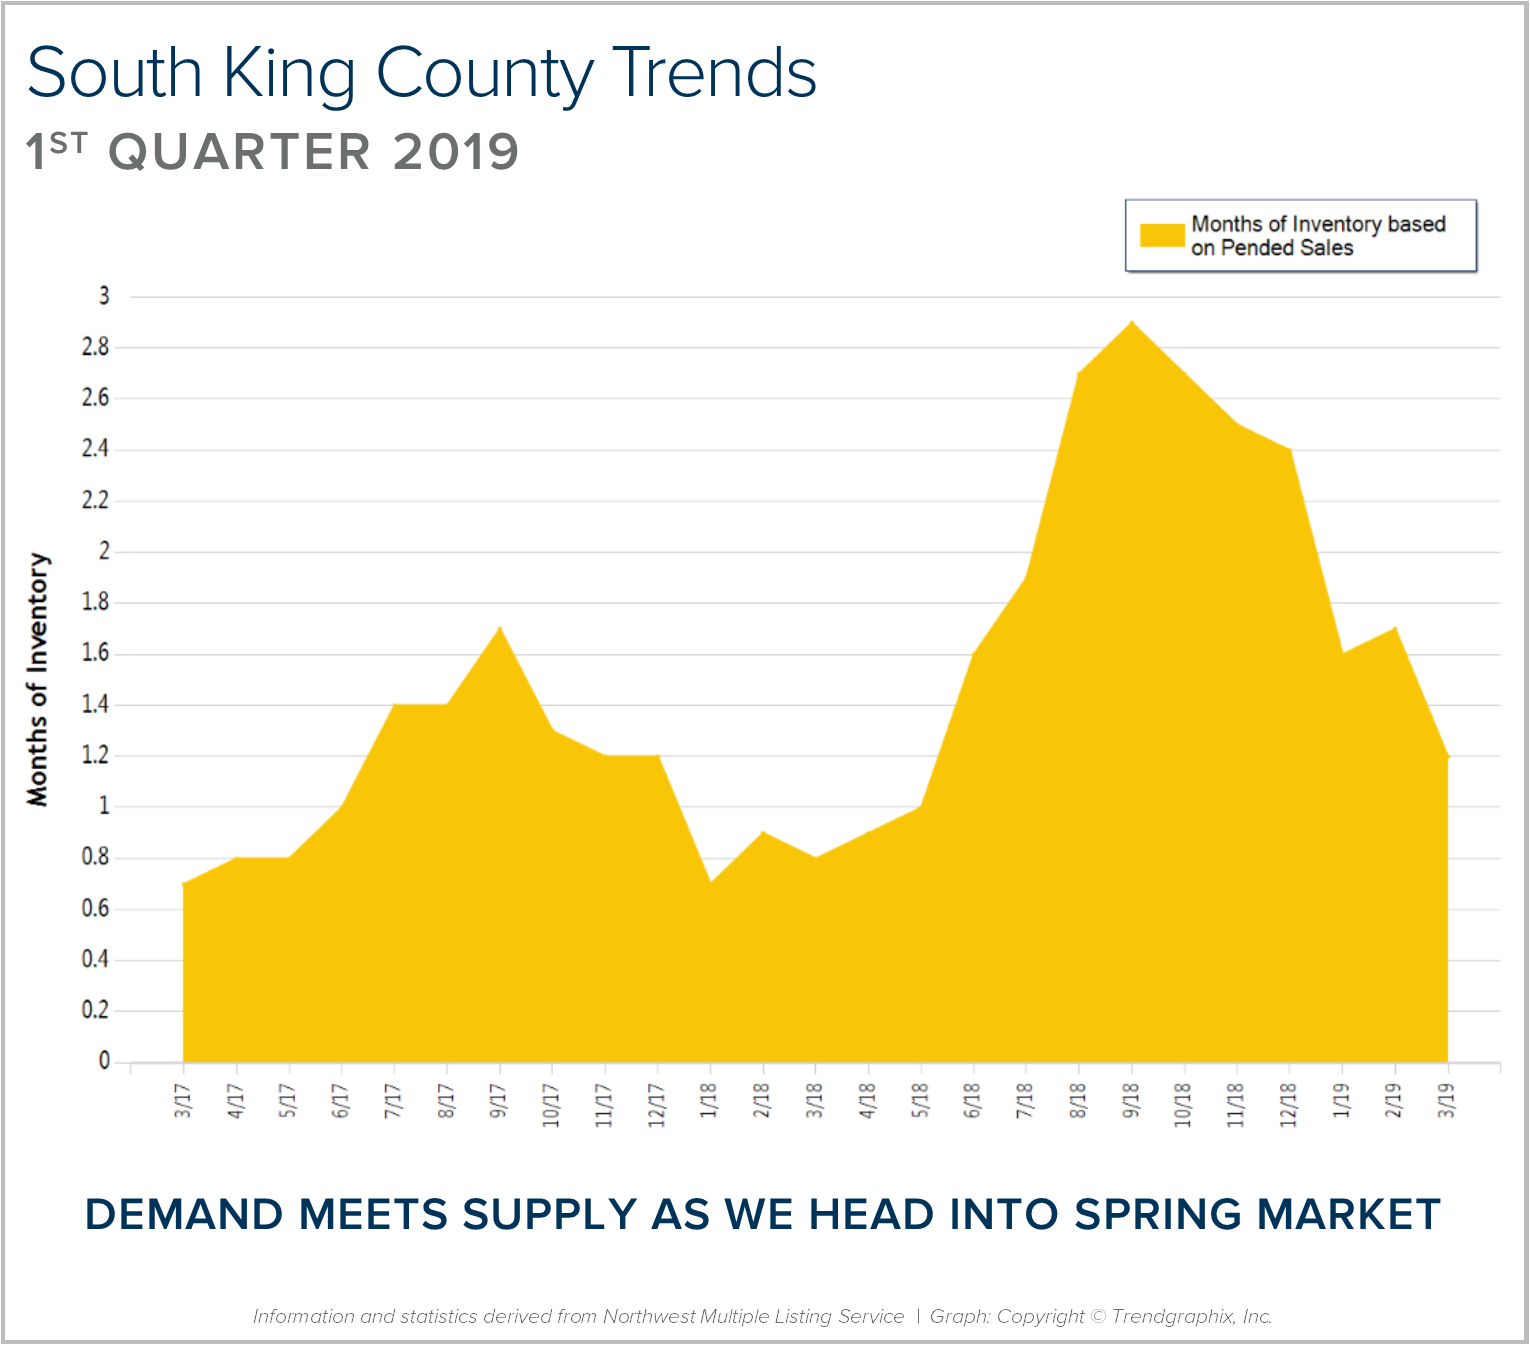
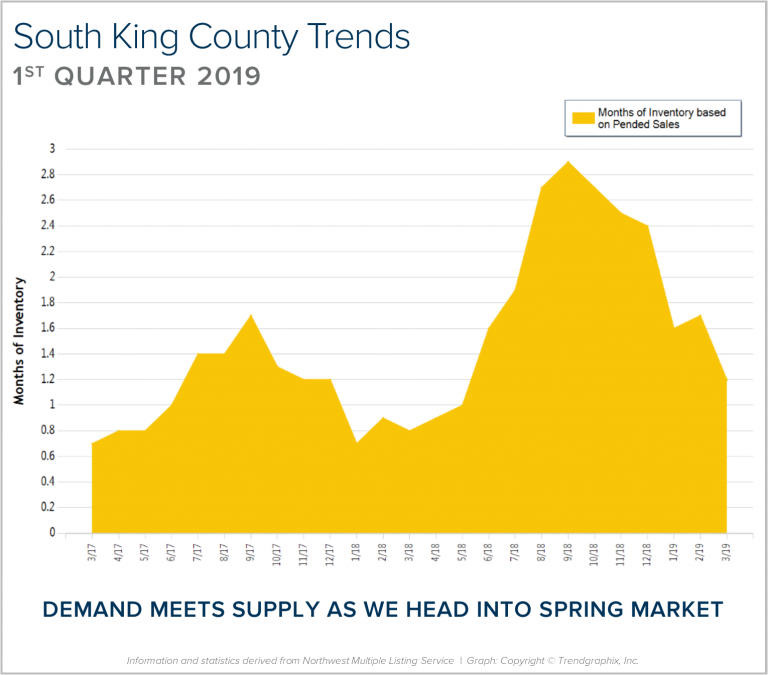 The first quarter of 2019 saw 2,306 new listings and 2,096 pending sales – demand tracked with supply quite well! It remains a seller’s market (0-3 months of inventory), but not as constricted of a market as last year, which saw an average of 0.8 months in the first quarter compared to 1.5 months this year. As we head into spring, we should see continued growth in new listings and demand will be strong, fueled by low interest rates and positive jobs reports.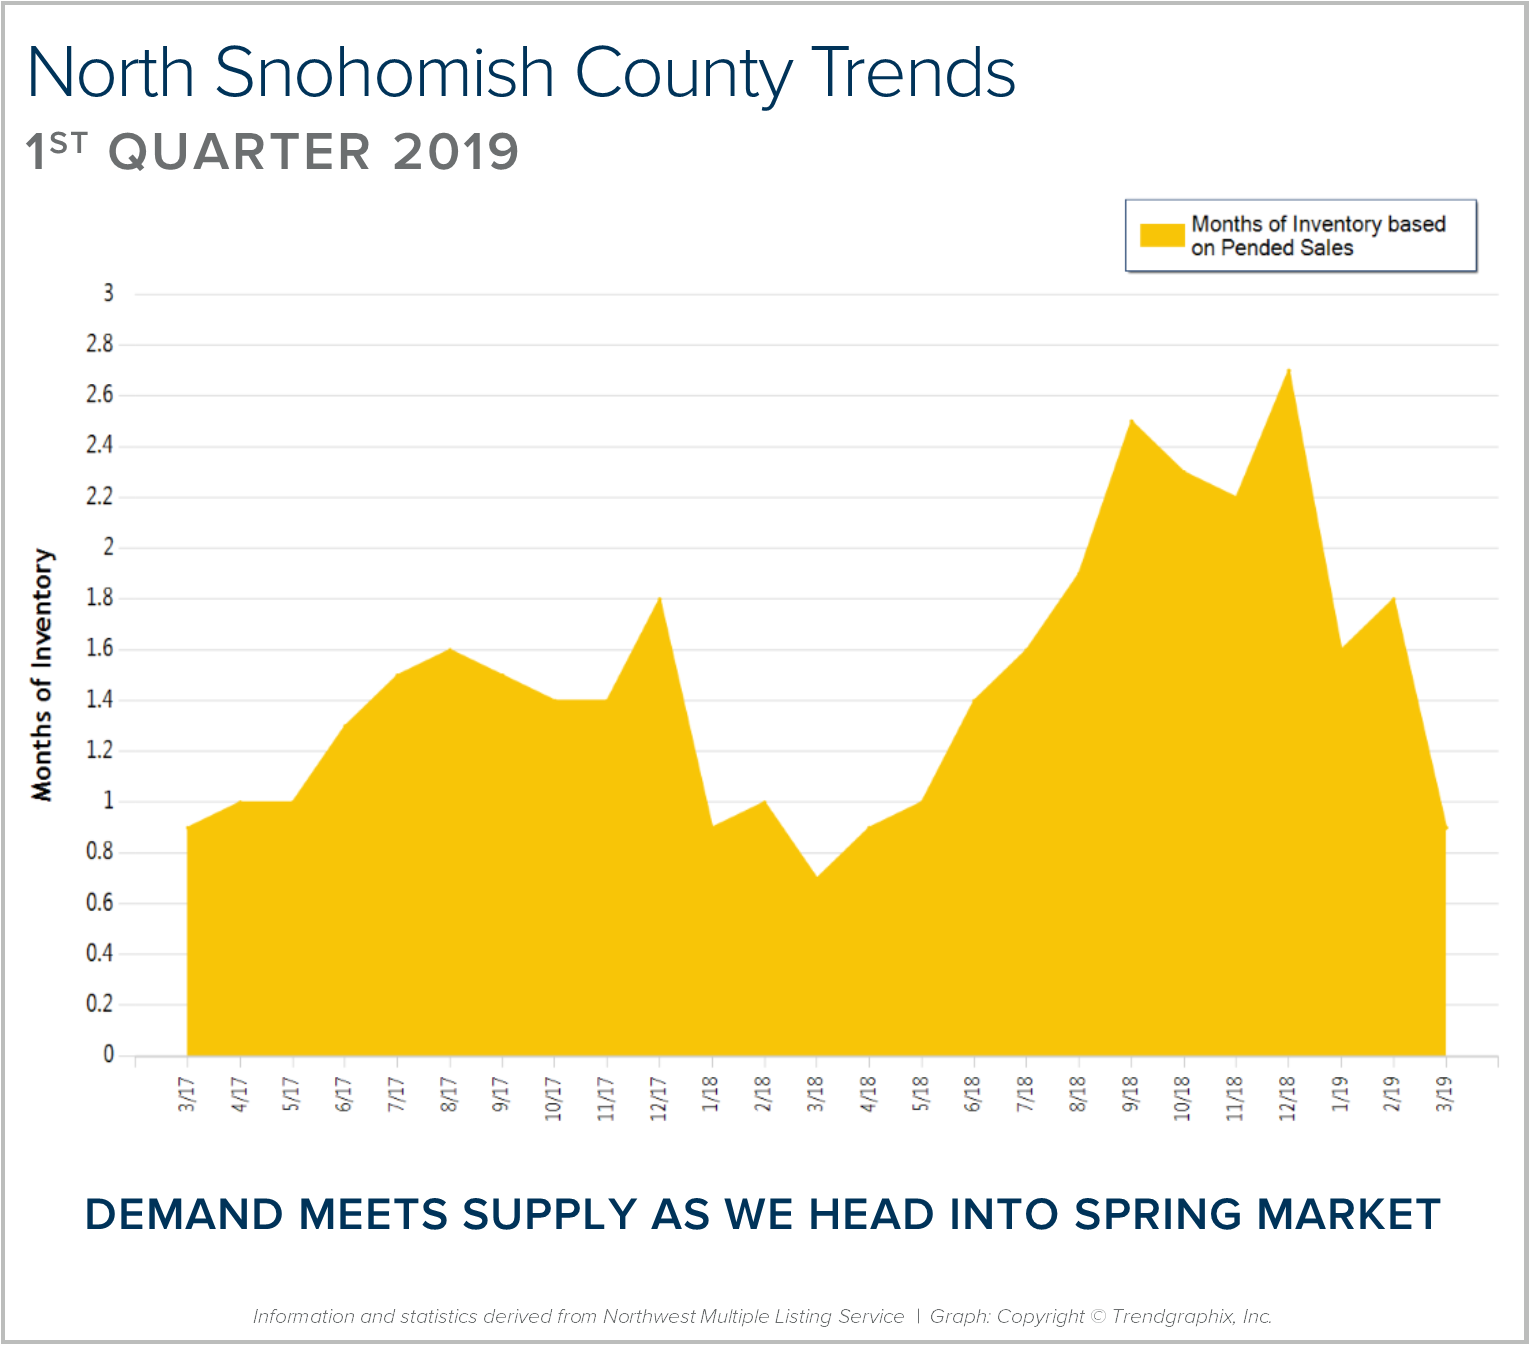
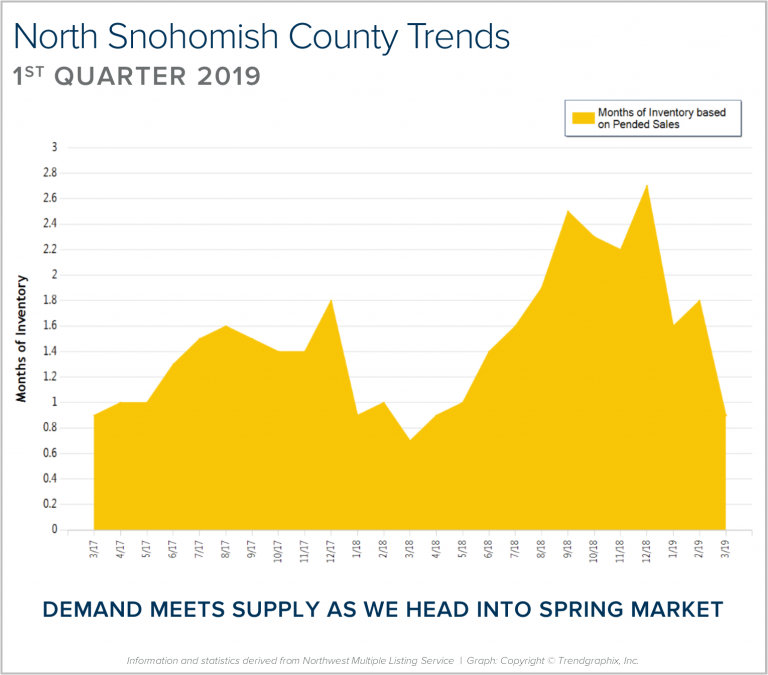 The first quarter of 2019 saw 934 new listings and 921 pending sales – demand tracked quite well with supply! It remains a seller’s market (0-3 months of inventory), but not as constricted of a market as last year, which saw an average of 0.9 months in the first quarter compared to 1.4 months this year. As we head into spring, we should see continued growth in new listings and demand will be strong, fueled by low interest rates and positive jobs reports.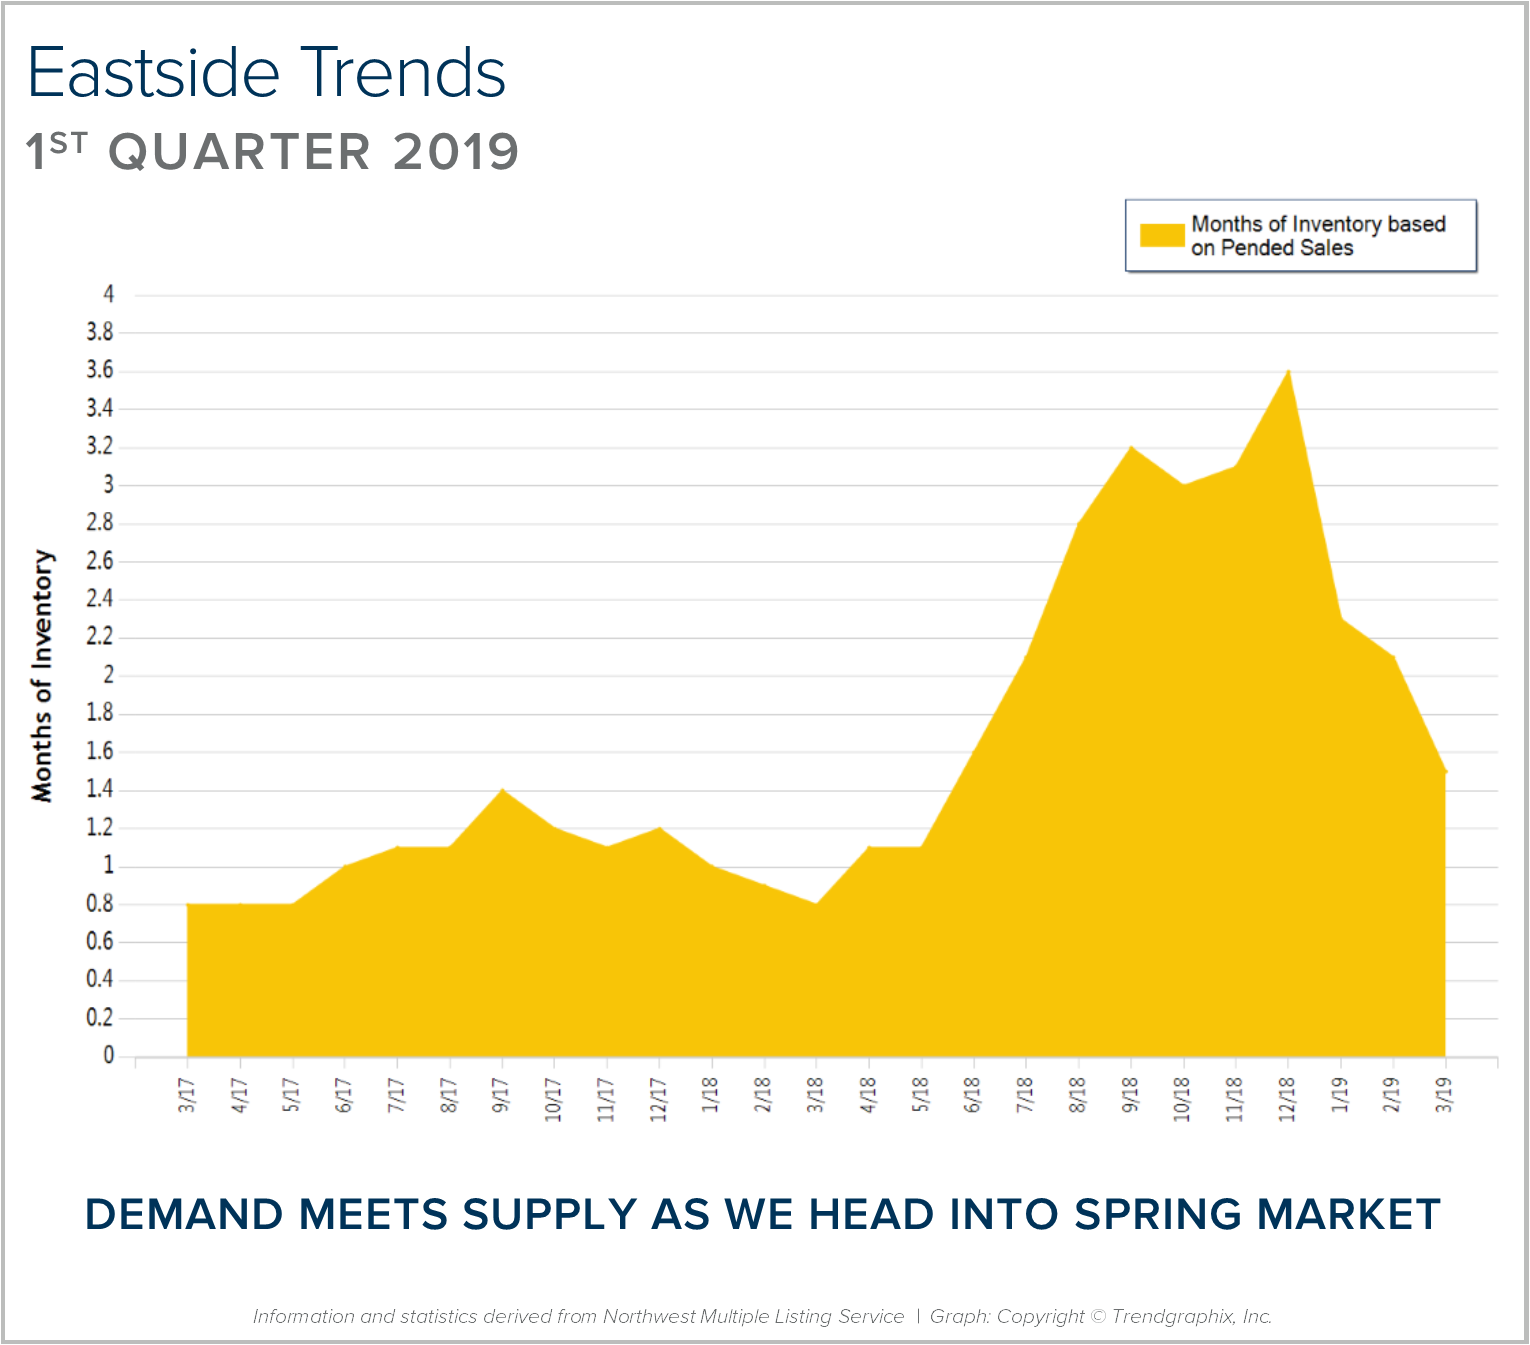
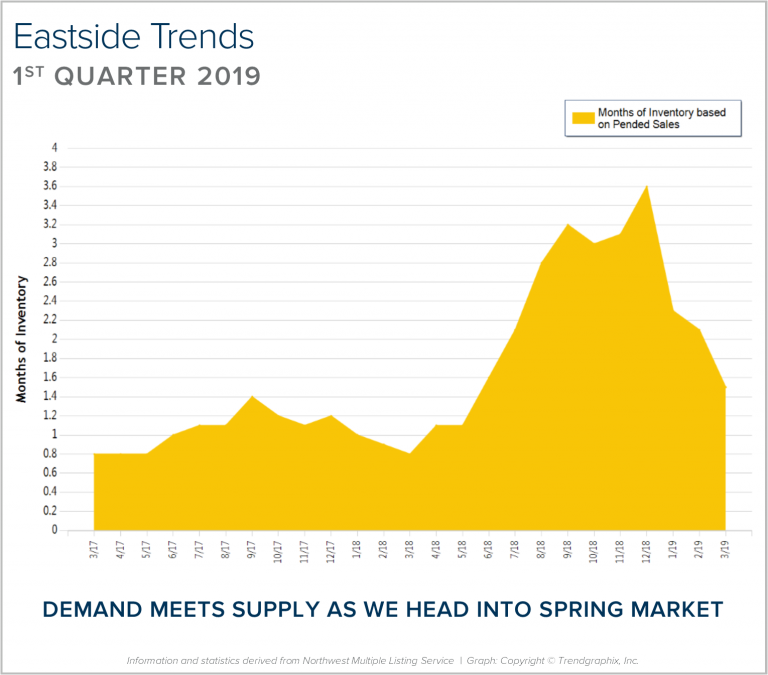 The first quarter of 2019 saw 2,304 new listings and 1,703 pending sales – demand tracked well with supply! It remains a seller’s market (0-3 months of inventory), but not as constricted of a market as last year, which saw an average of 0.9 months in the first quarter compared to 2 months this year. As we head into spring, we should see continued growth in new listings and demand will be strong, fueled by low interest rates and positive jobs reports.