
 Facebook
 X
X
 Pinterest
 Copy Link
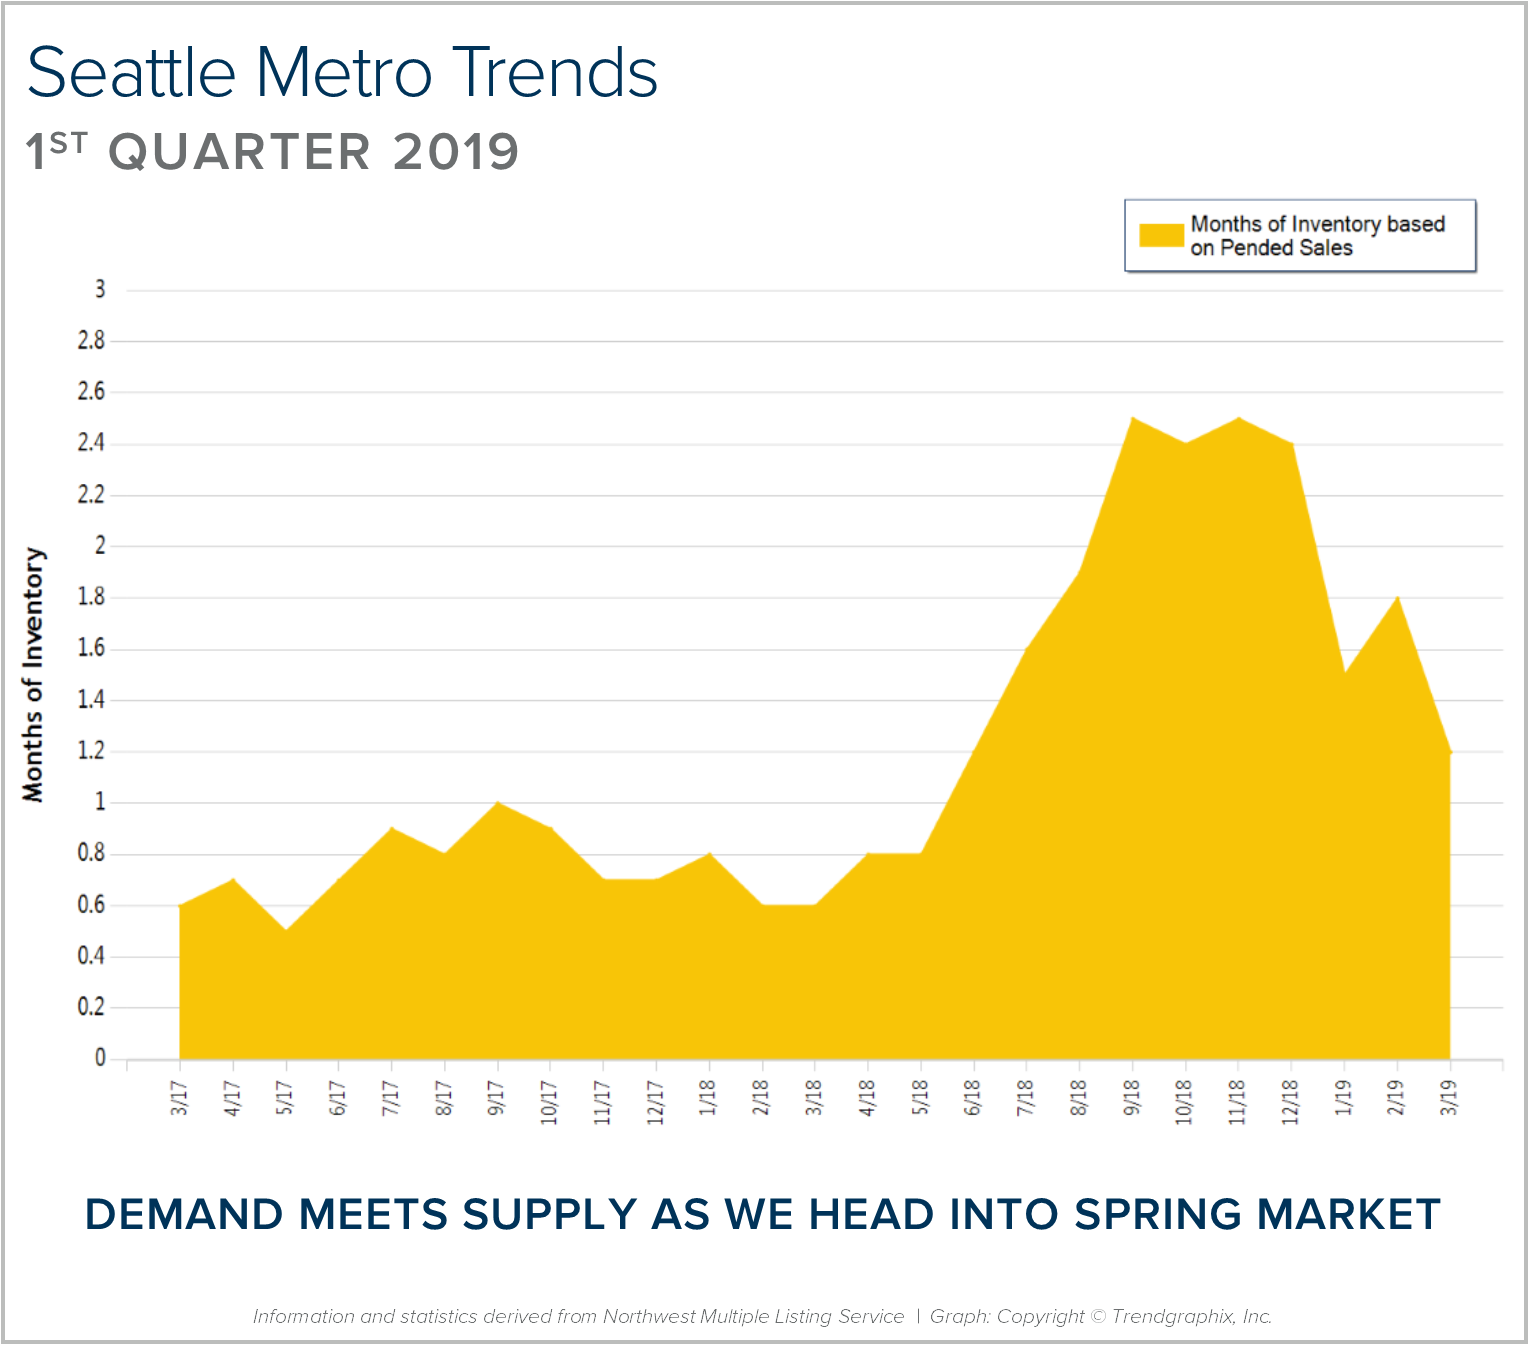
Q1: January 1 – March 31, 2019
SEATTLE METRO: Months of inventory was reduced as we finished out the first quarter of 2019. Months of inventory is the amount of months it would take to sell out of homes if no new listings came to market. This illustrates the balance between supply and demand. We peaked at 2.5 months in November of 2018 and found ourselves at 1.2 month this March.
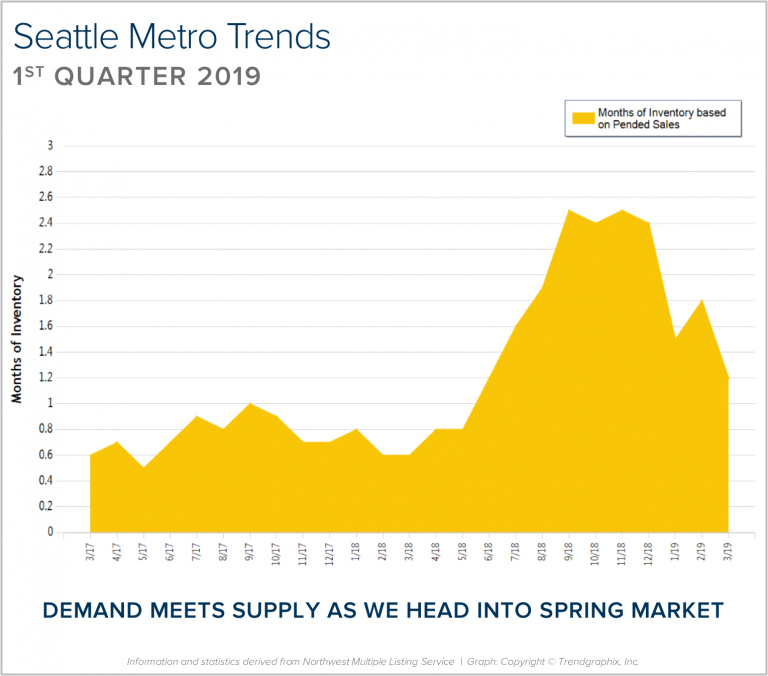 The first quarter of 2019 saw 2,456 new listings and 1,892 pending sales – demand tracked quite well with supply! It remains a seller’s market (0-3 months of inventory), but not as constricted of a market as last year, which saw an average of 0.7 months in the first quarter compared to 1.5 months this year. As we head into spring, we should see continued growth in new listings and demand will be strong, fueled by low interest rates and positive jobs reports.
The second half of 2018 had a large influx of homes that came to market, and an interest rate jump which created a gap between supply and demand. Buyers enjoyed some negotiations and credits in the fall and winter due to more selection, but as interest rates reduced in the first quarter, we saw demand increase. This is helping to absorb inventory and reduce the average days on market it takes to sell a home. Median price is up 5% complete year-over-year, which is still higher than the 4% norm, but much less than the unsustainable 16% gains from 2017 to 2018. This balancing out in the market has been a positive phenomenon as affordability has been a challenge for many. Both sellers and buyers are finding great opportunities in the current market.
This is only a snapshot of the trends in the Seattle Metro area; please contact us if you would like further explanation of how the latest trends relate to you.
